
Client
Prof. Andrea Gautier, University of Toronto
Role
Research, Infographic Designer, Illustration
Year
2018
Description
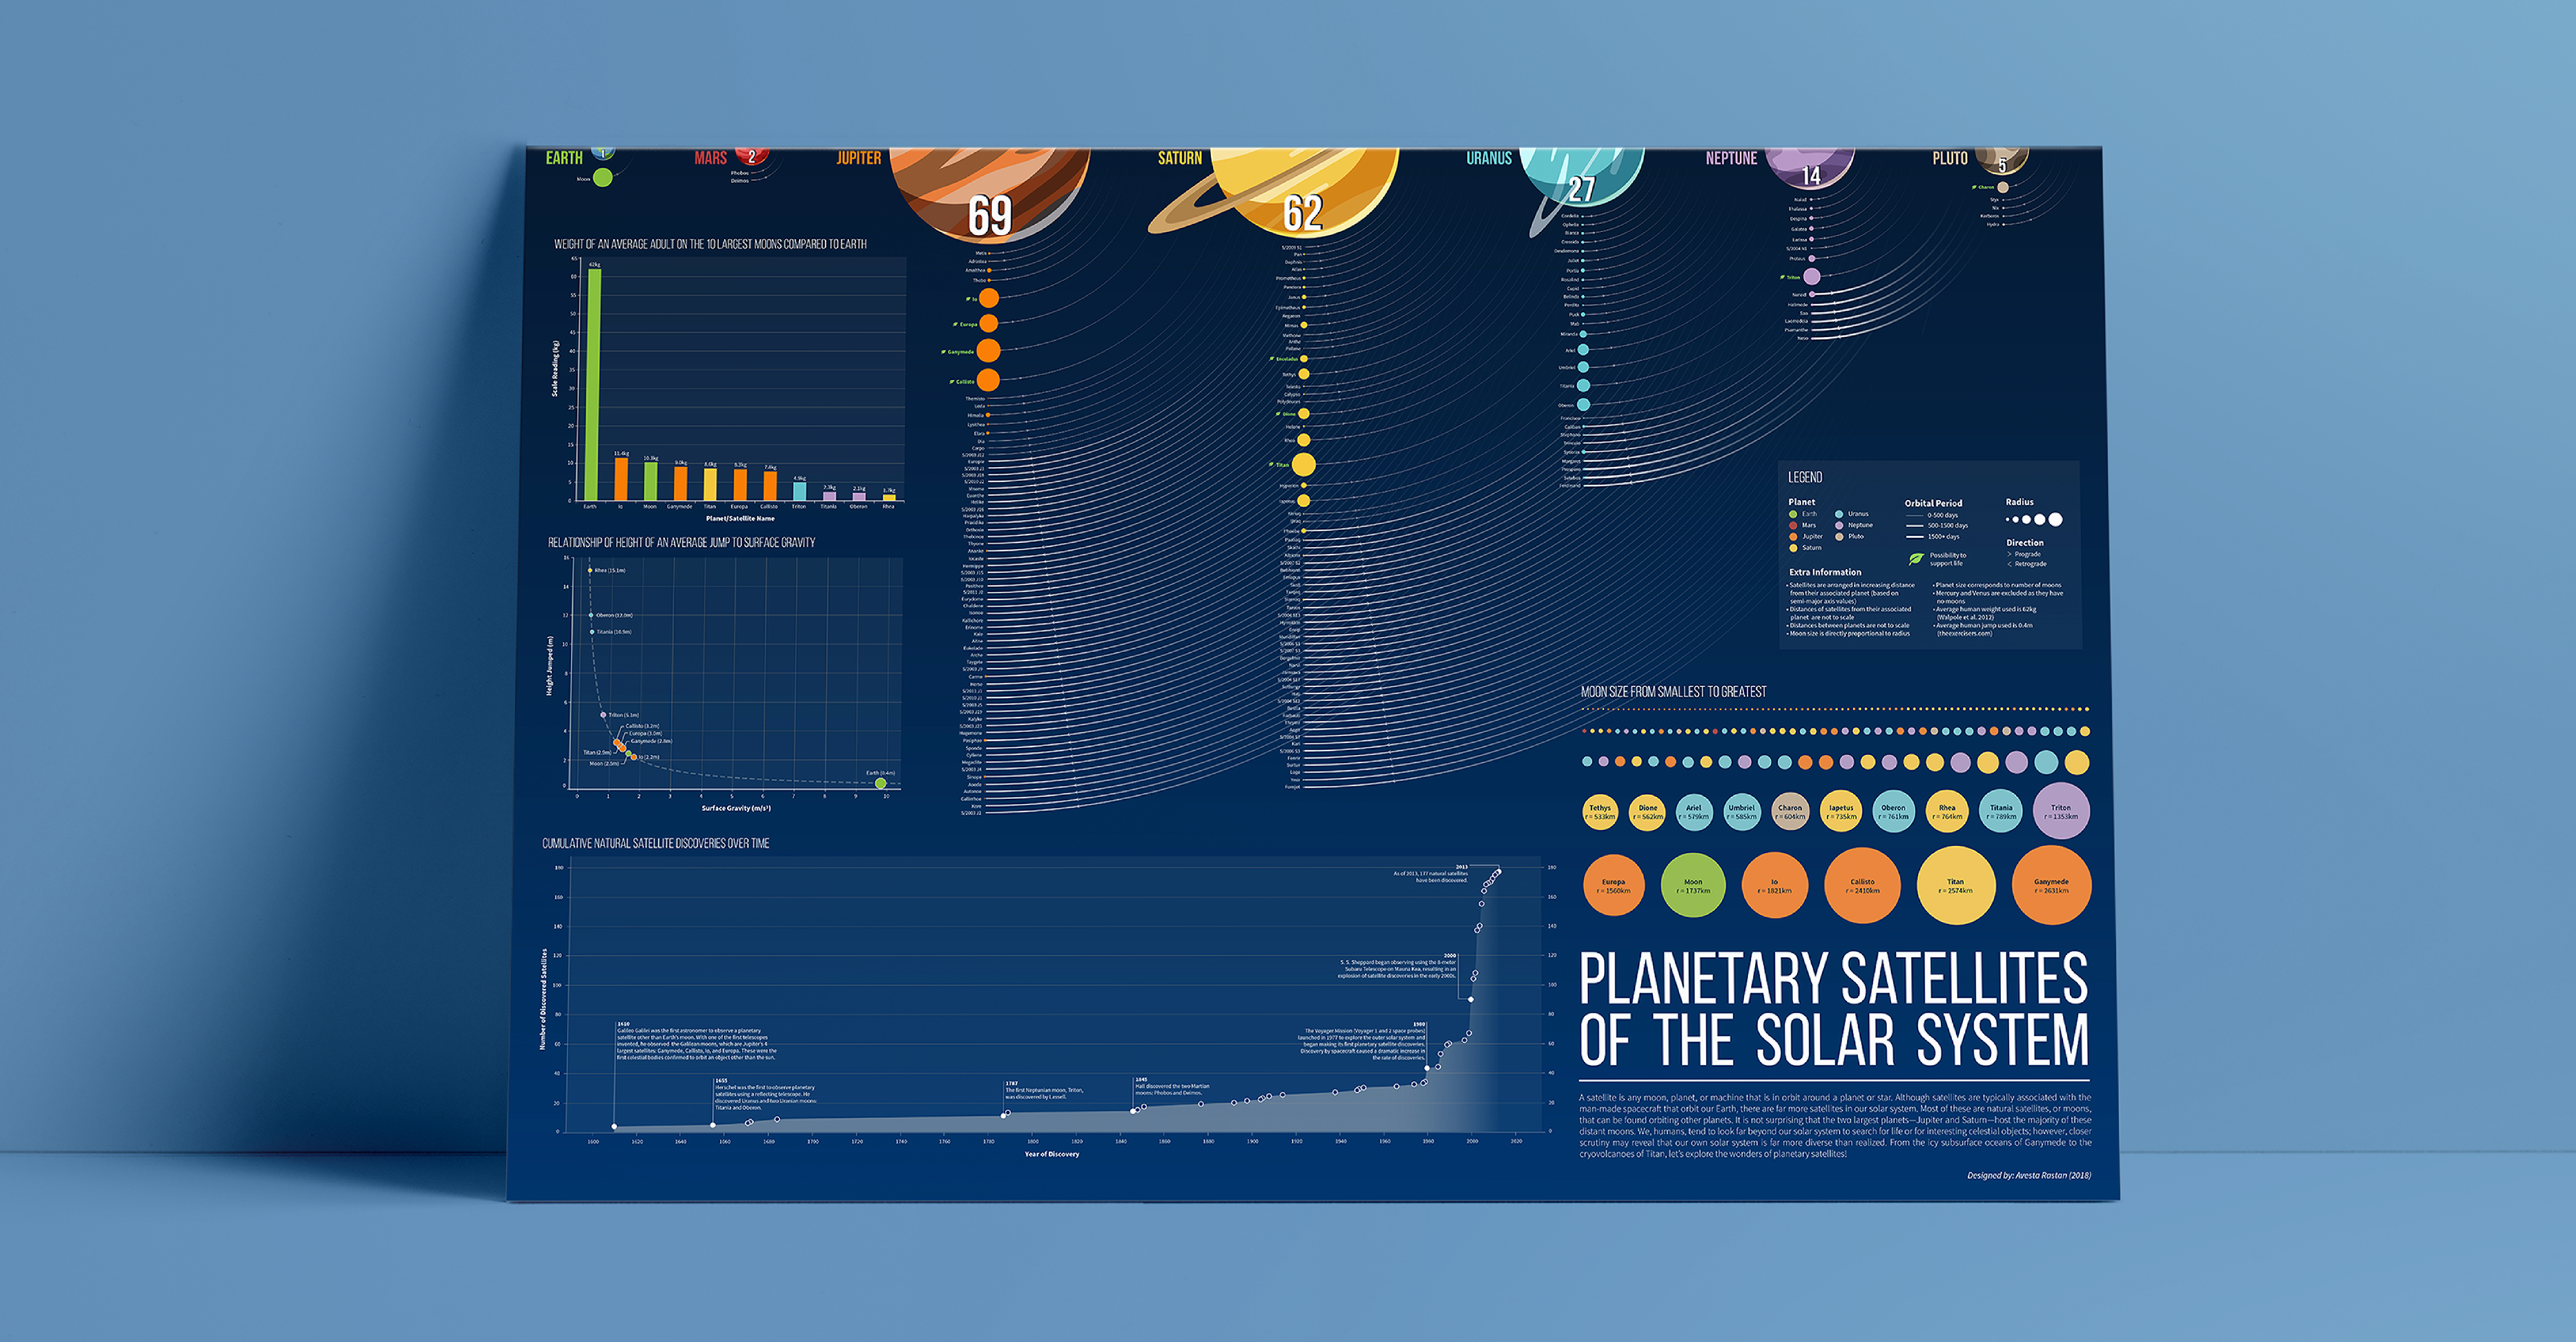
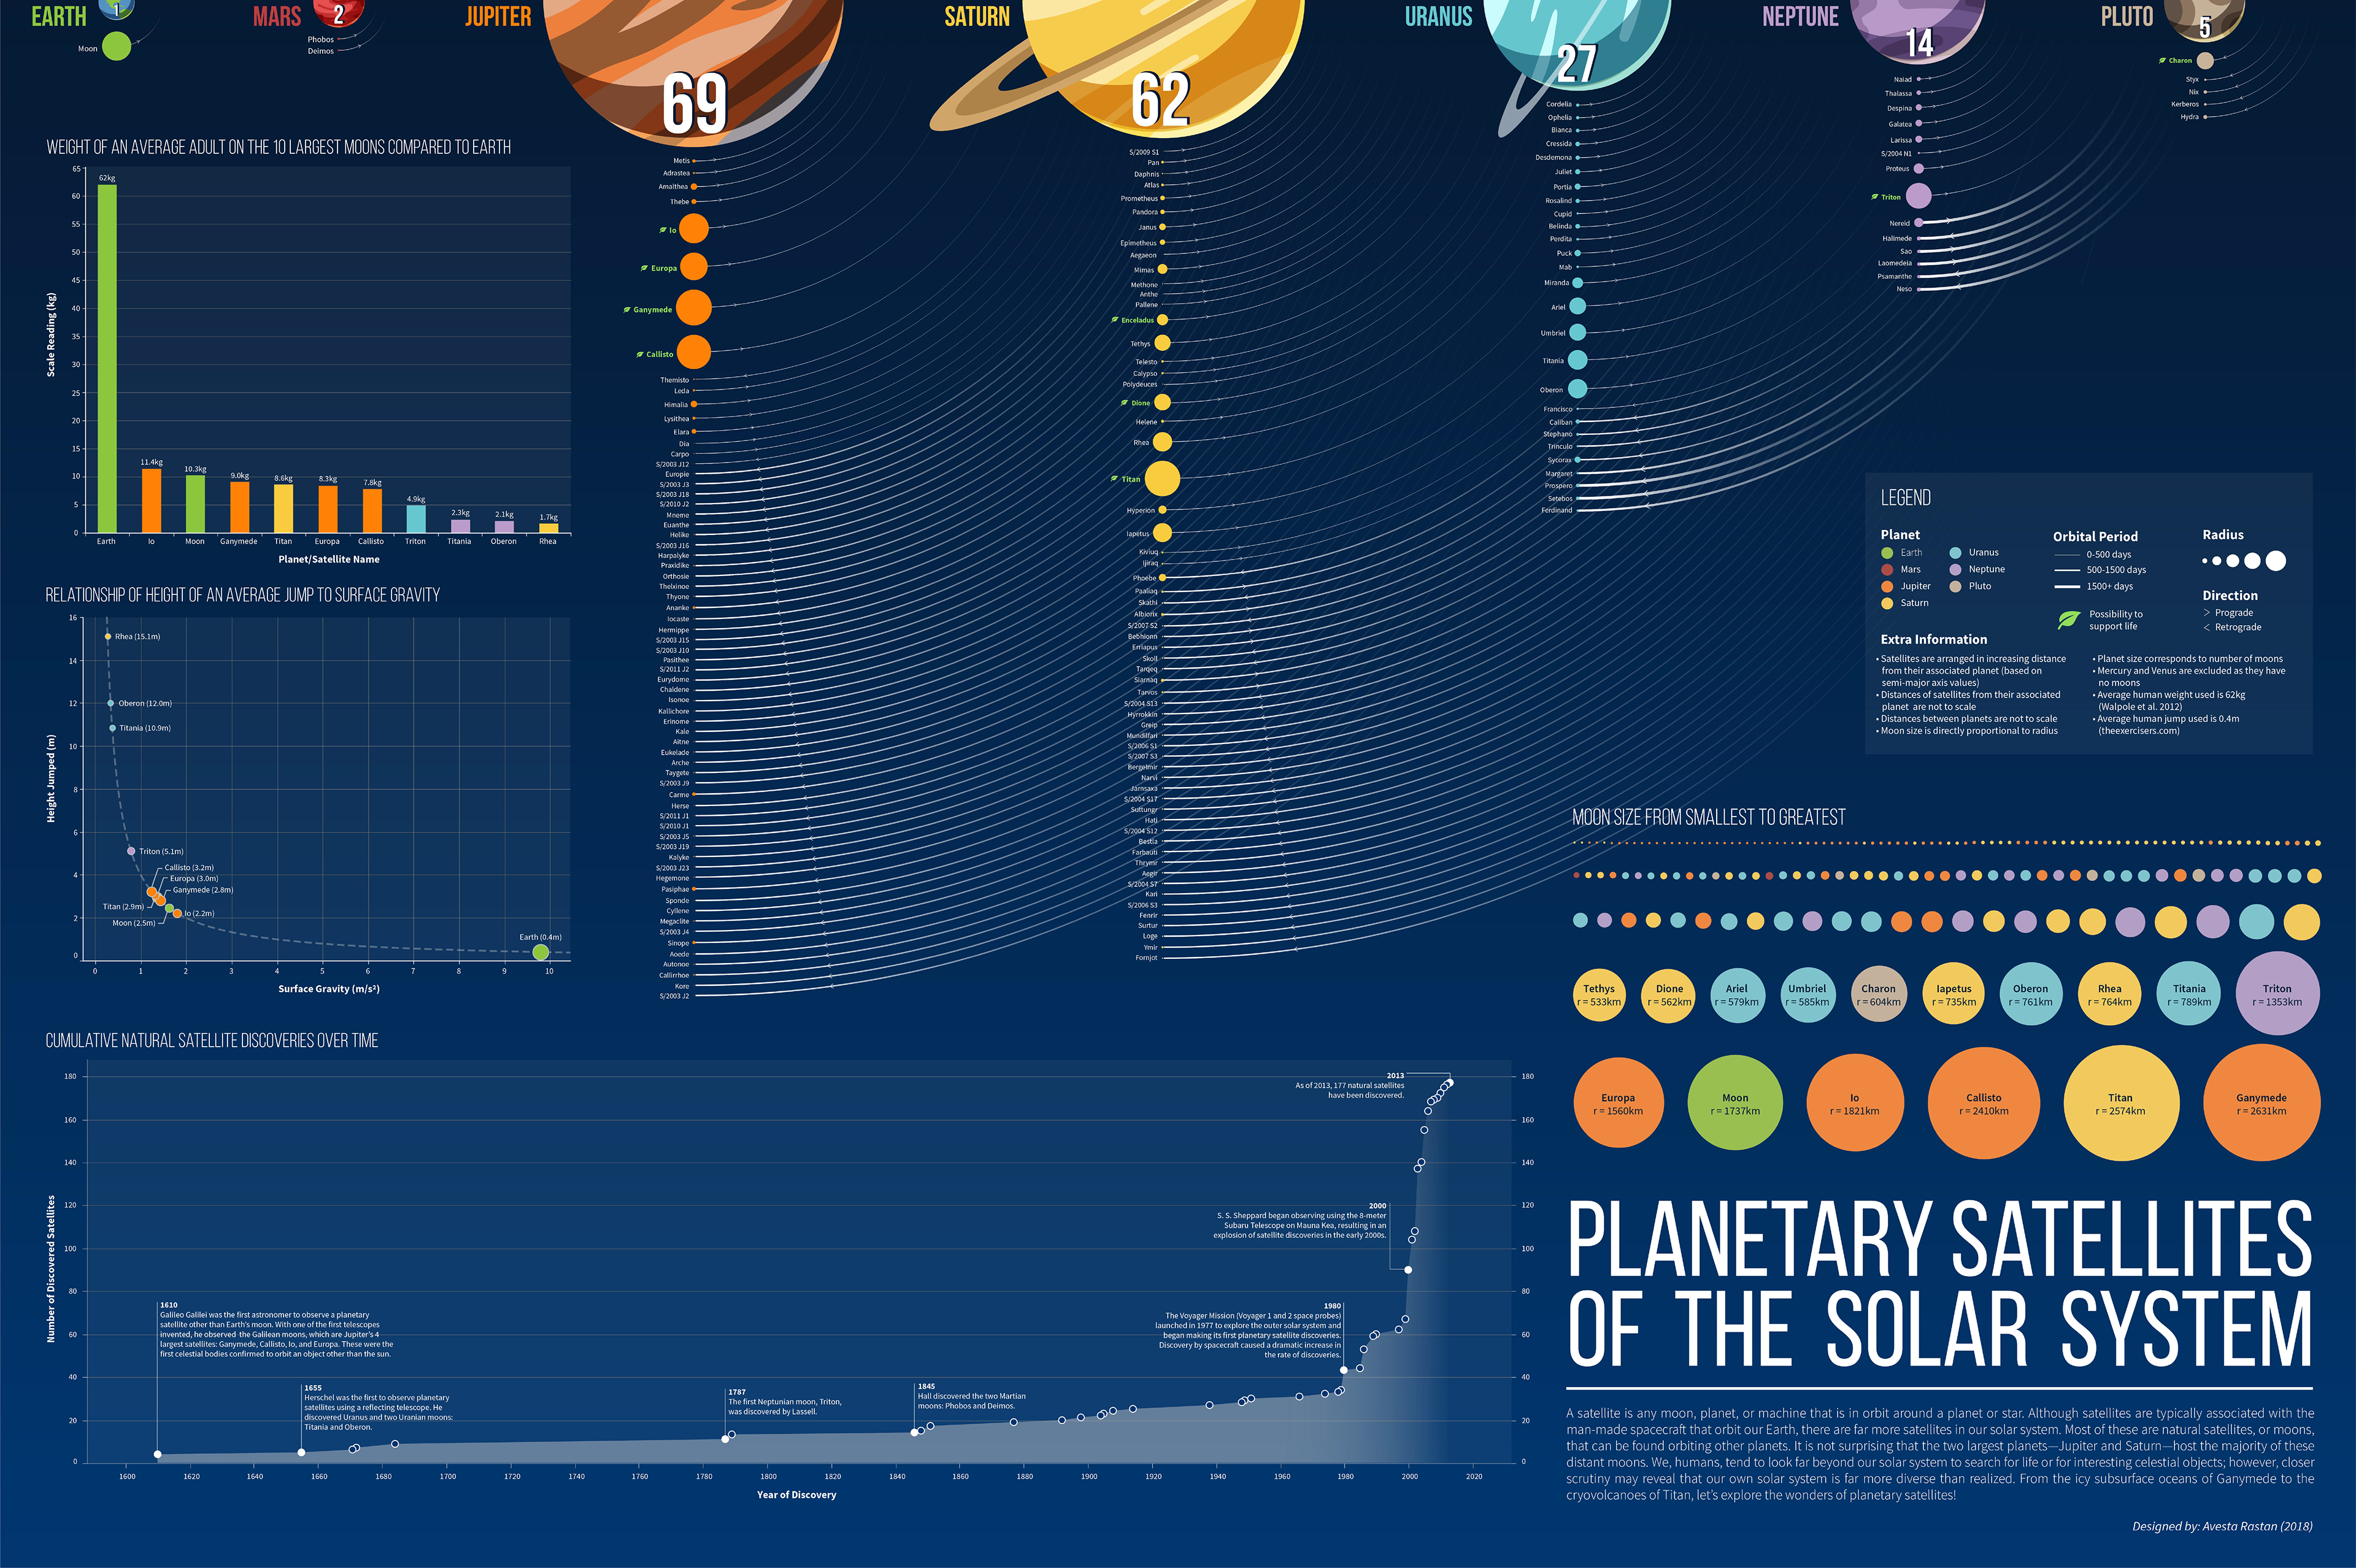
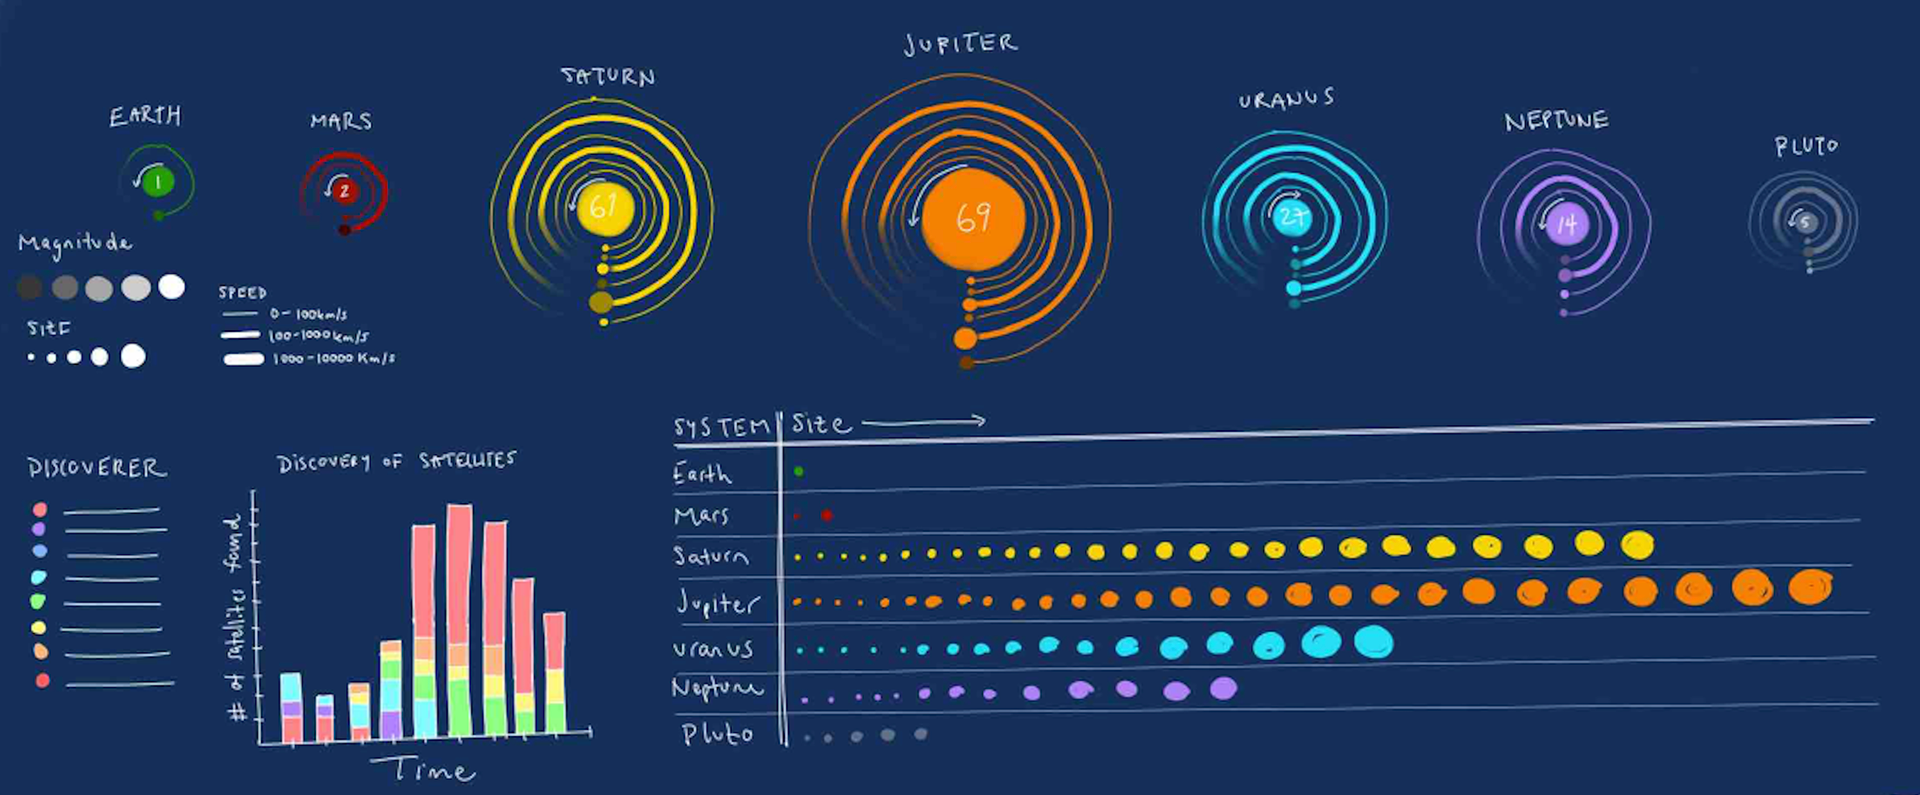
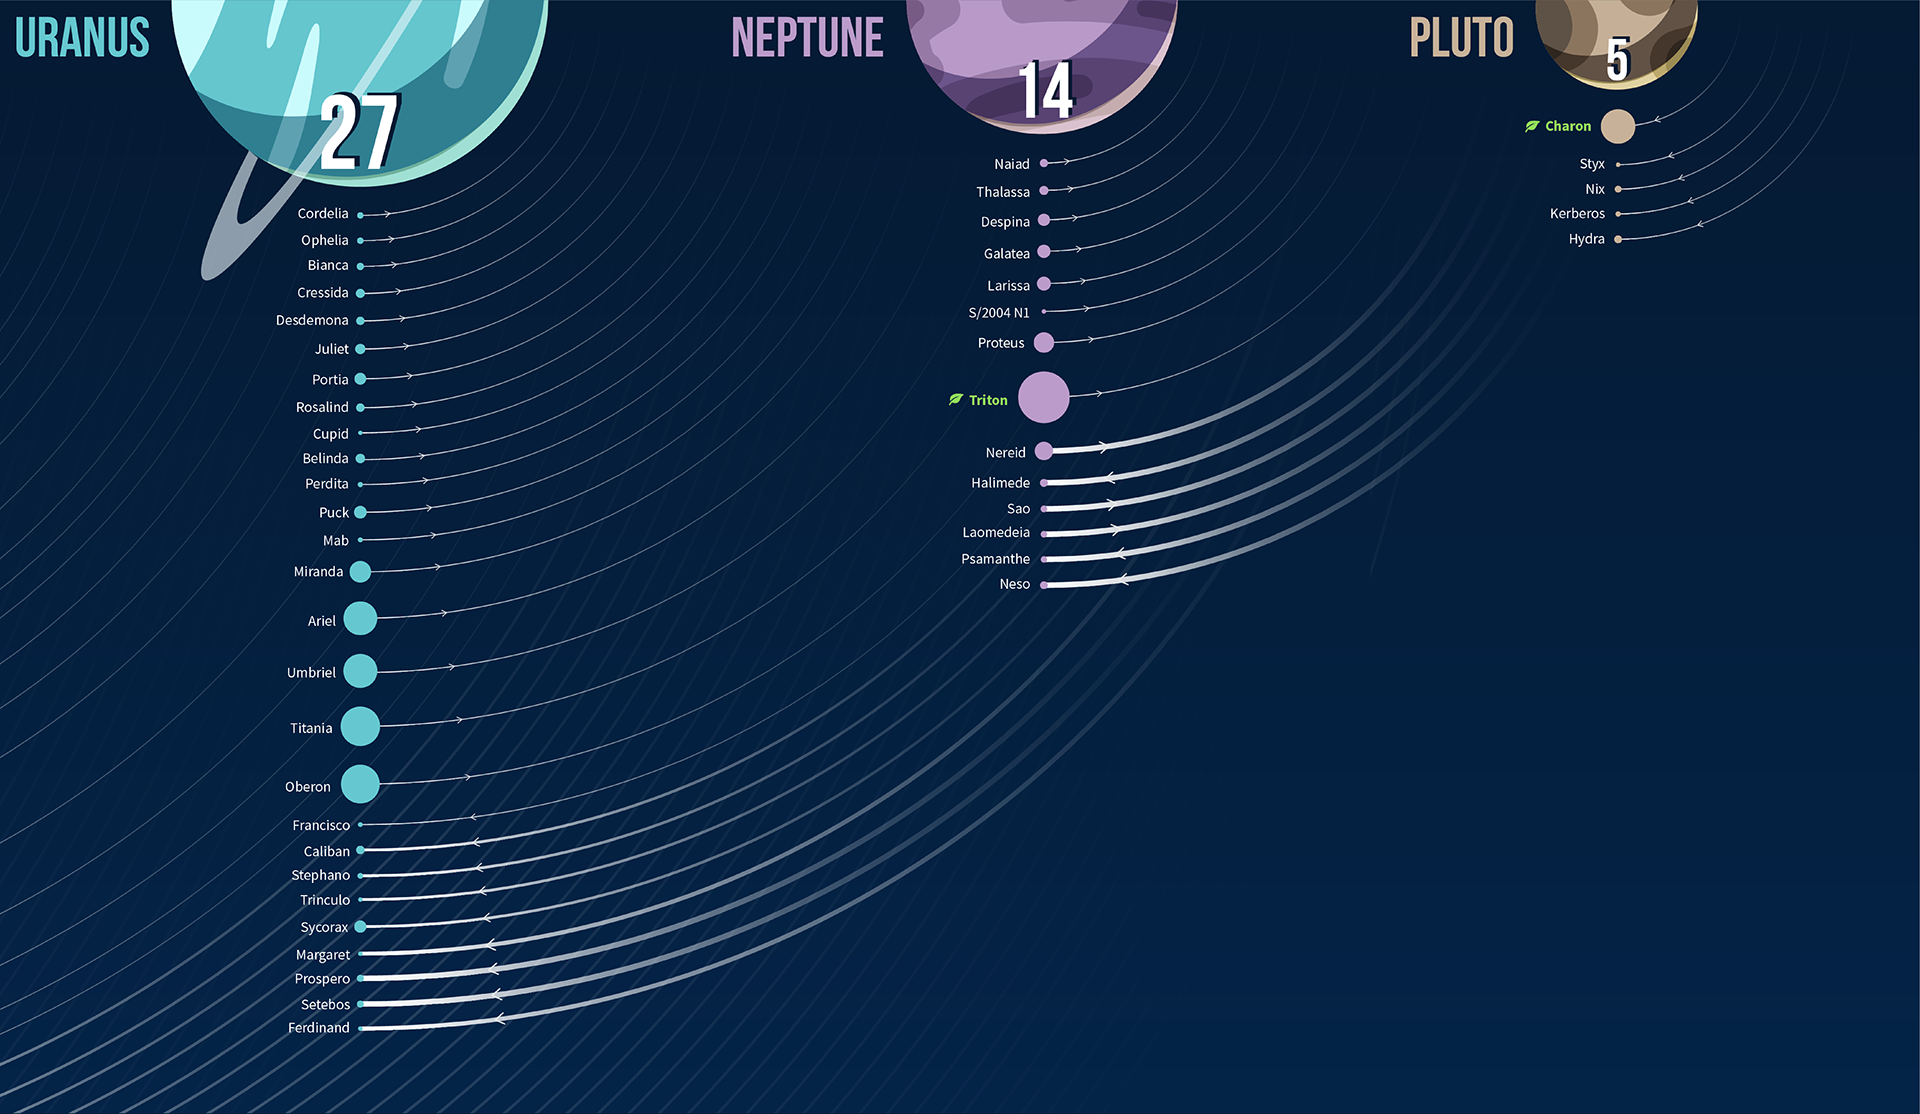
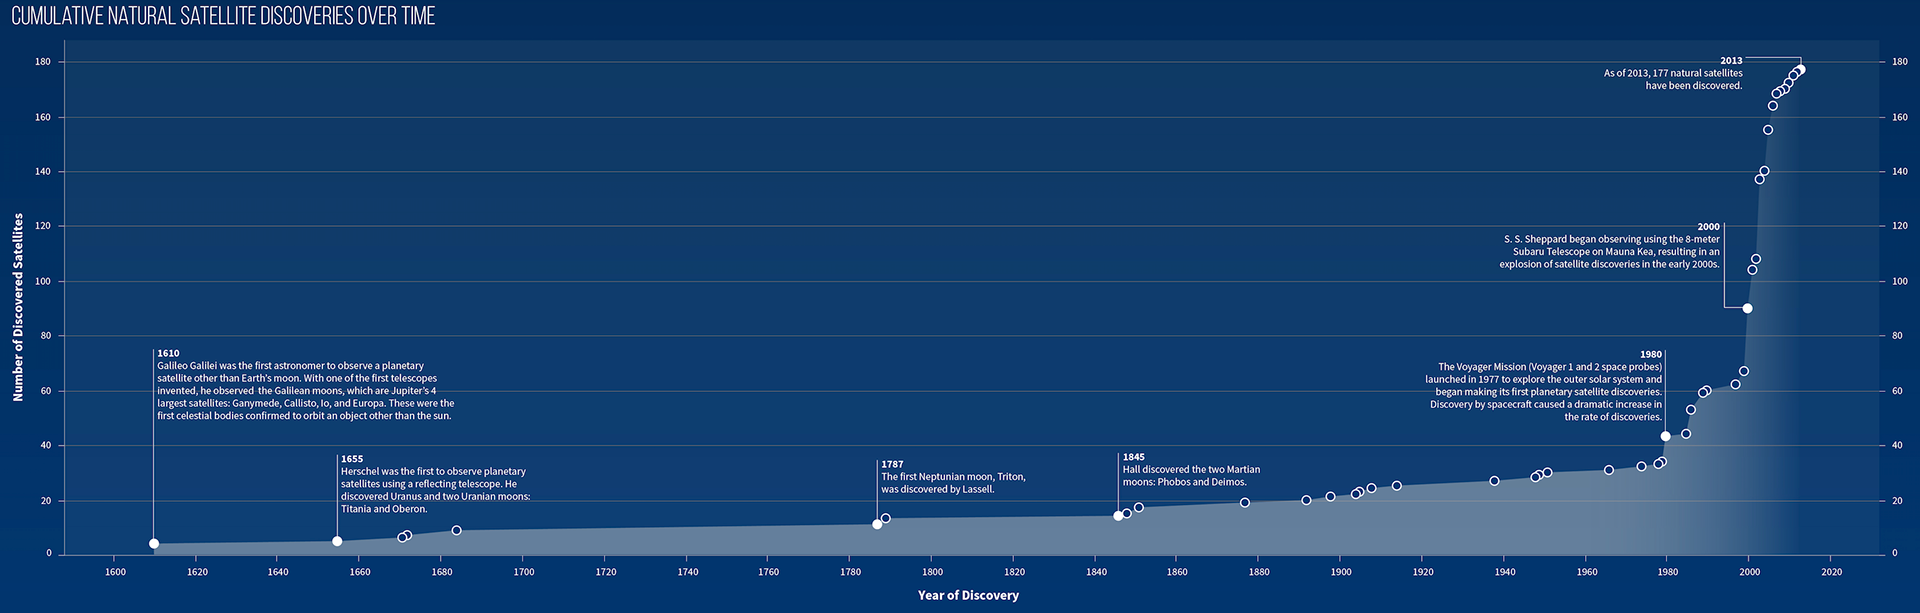
A satellite is any moon, planet, or machine that is in orbit around a planet or star. Although satellites are typically associated with the man-made spacecraft that orbit our Earth, there are far more satellites in our solar system. Most of these are natural satellites, or moons, that can be found orbiting other planets. We, humans, tend to look far beyond our solar system to search for life or for interesting celestial objects; however, closer scrutiny may reveal that our own solar system is far more diverse than realized. The data for this piece was taken primarily from the Jet Propulsion Laboratory (JPL) at NASA, specifically their Solar System Dynamics website, for the purpose of exploring the wonders of planetary satellites.
Awards: Adobe Design Awards 2019
Ideation
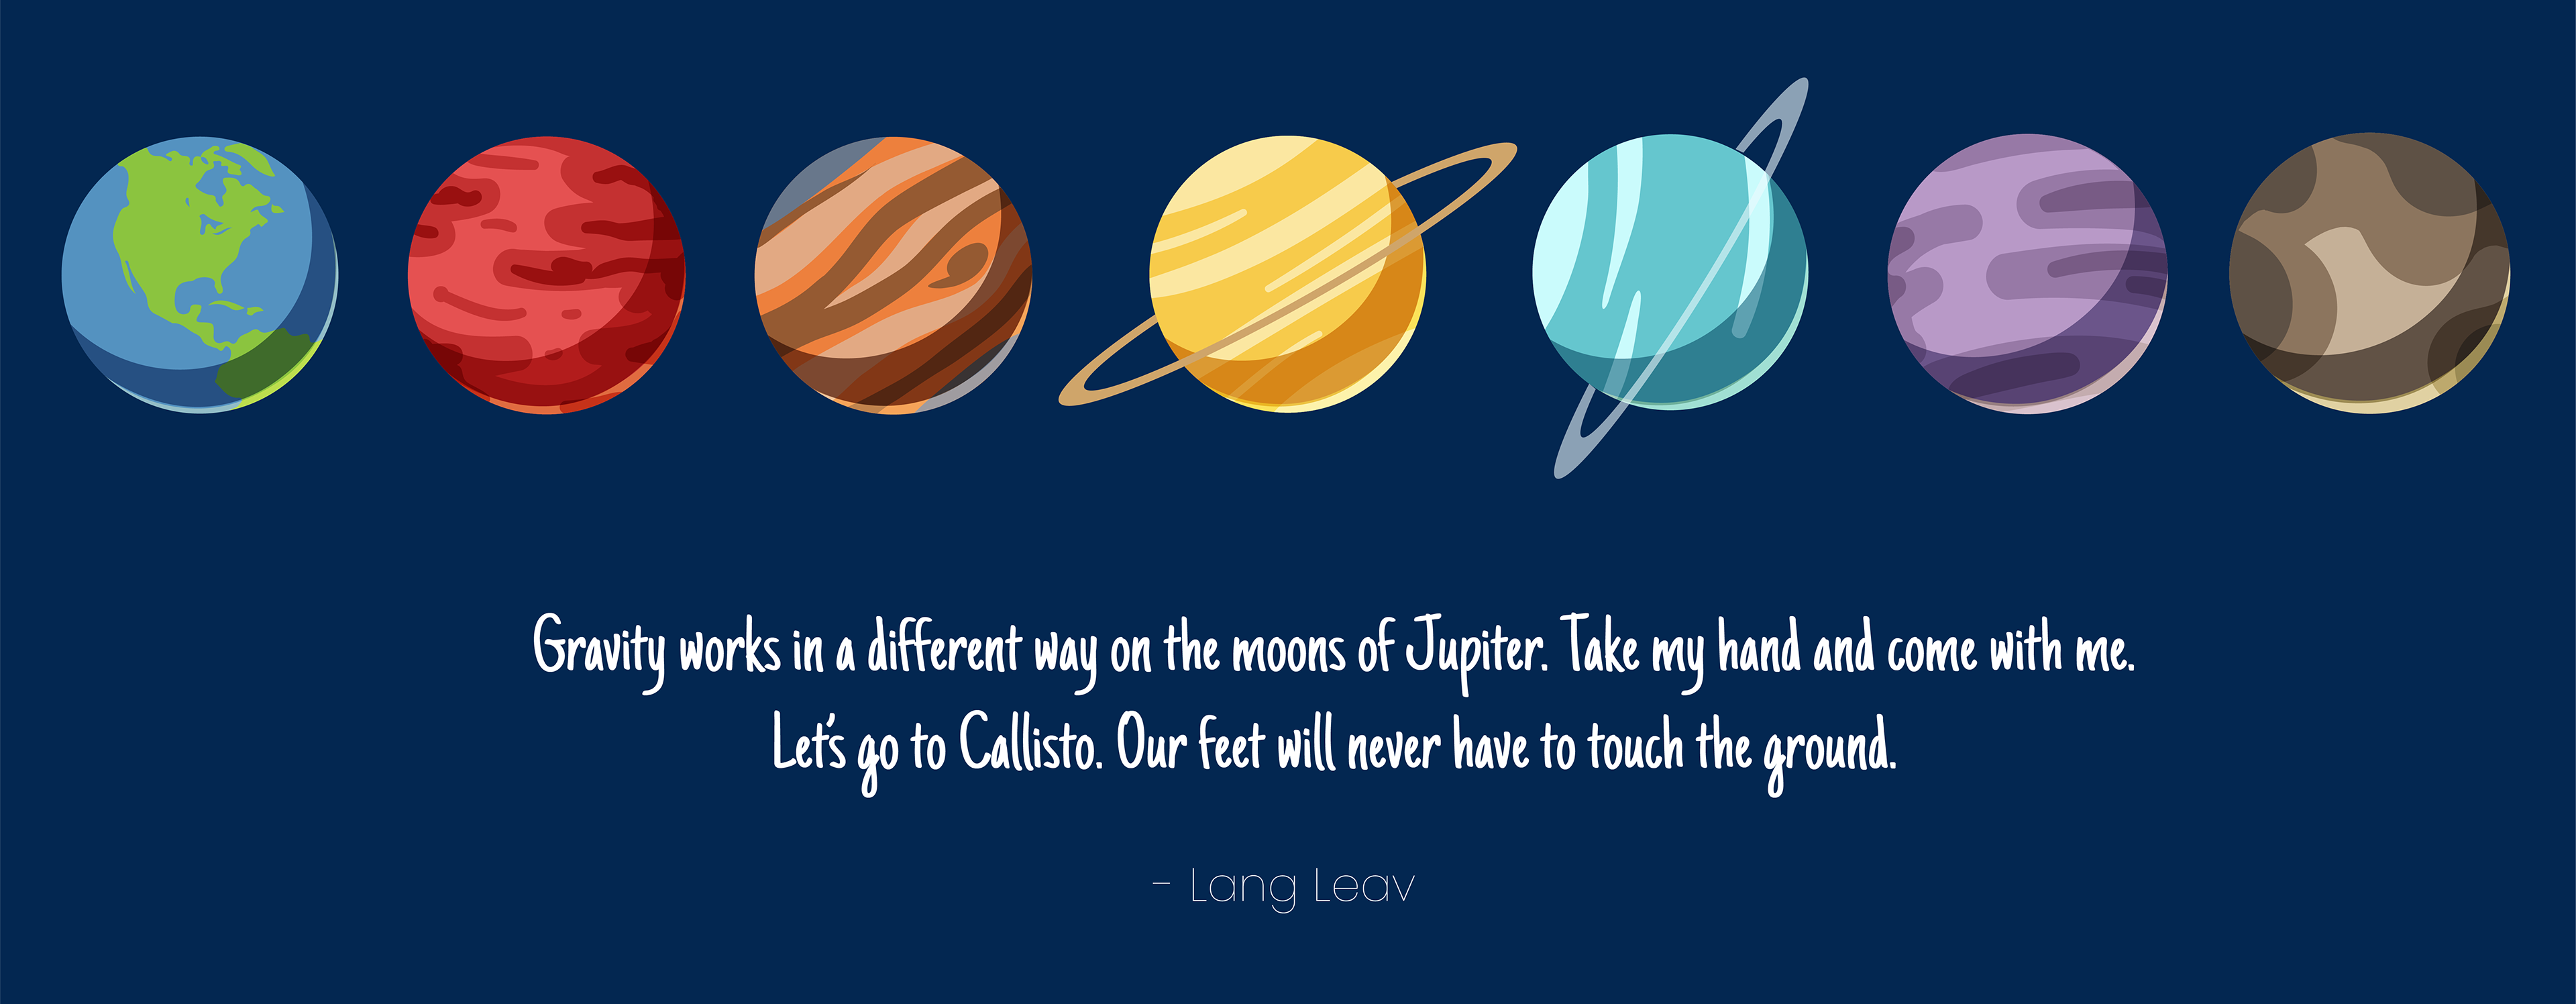
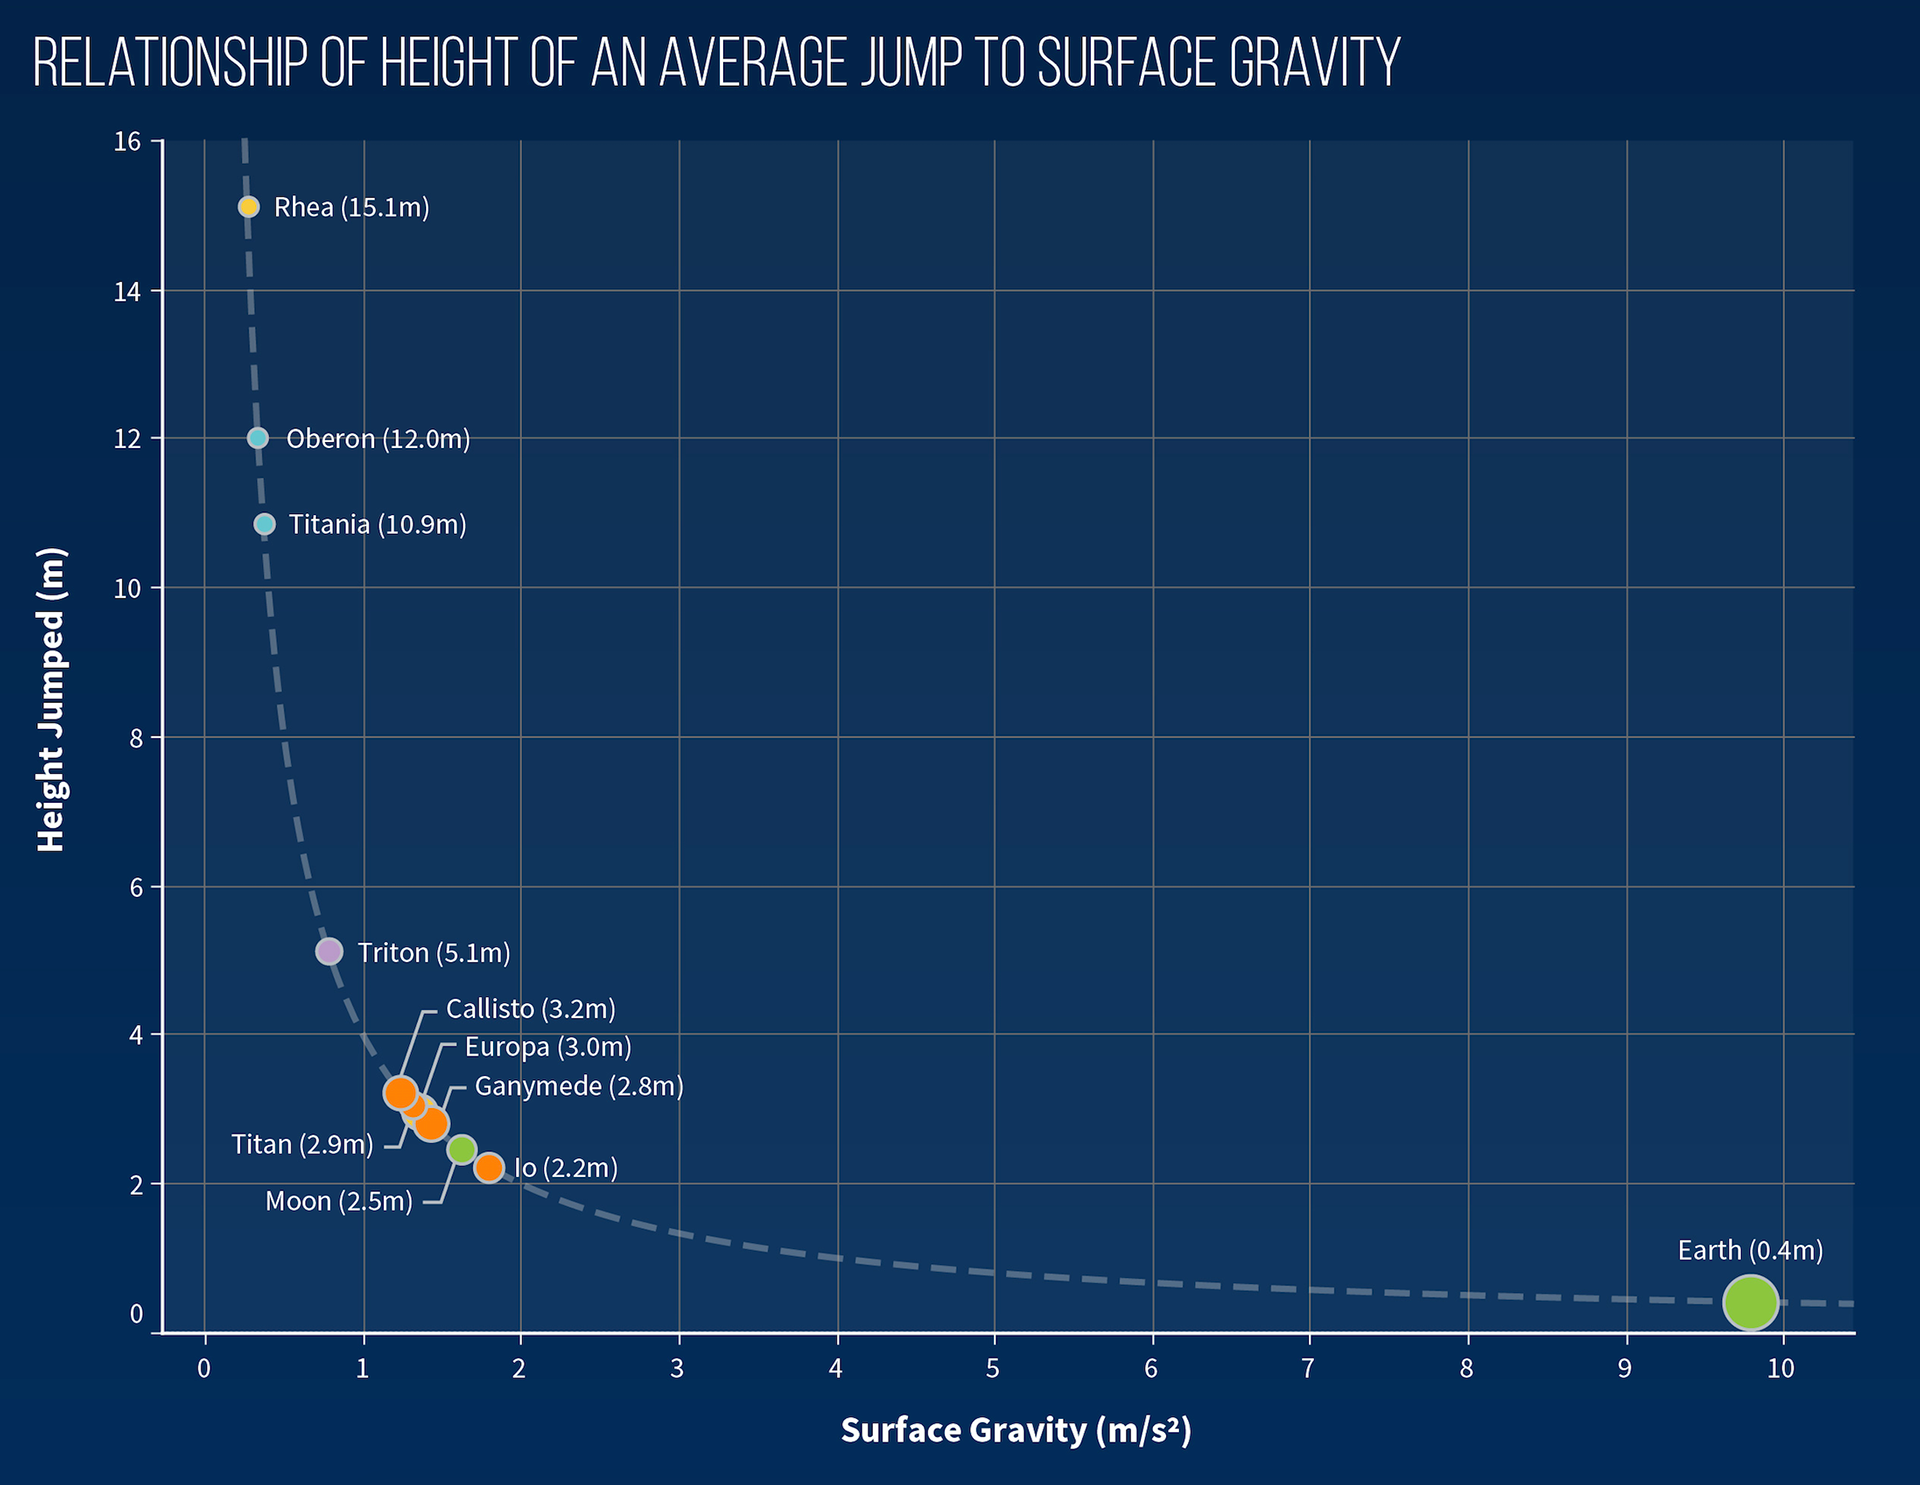
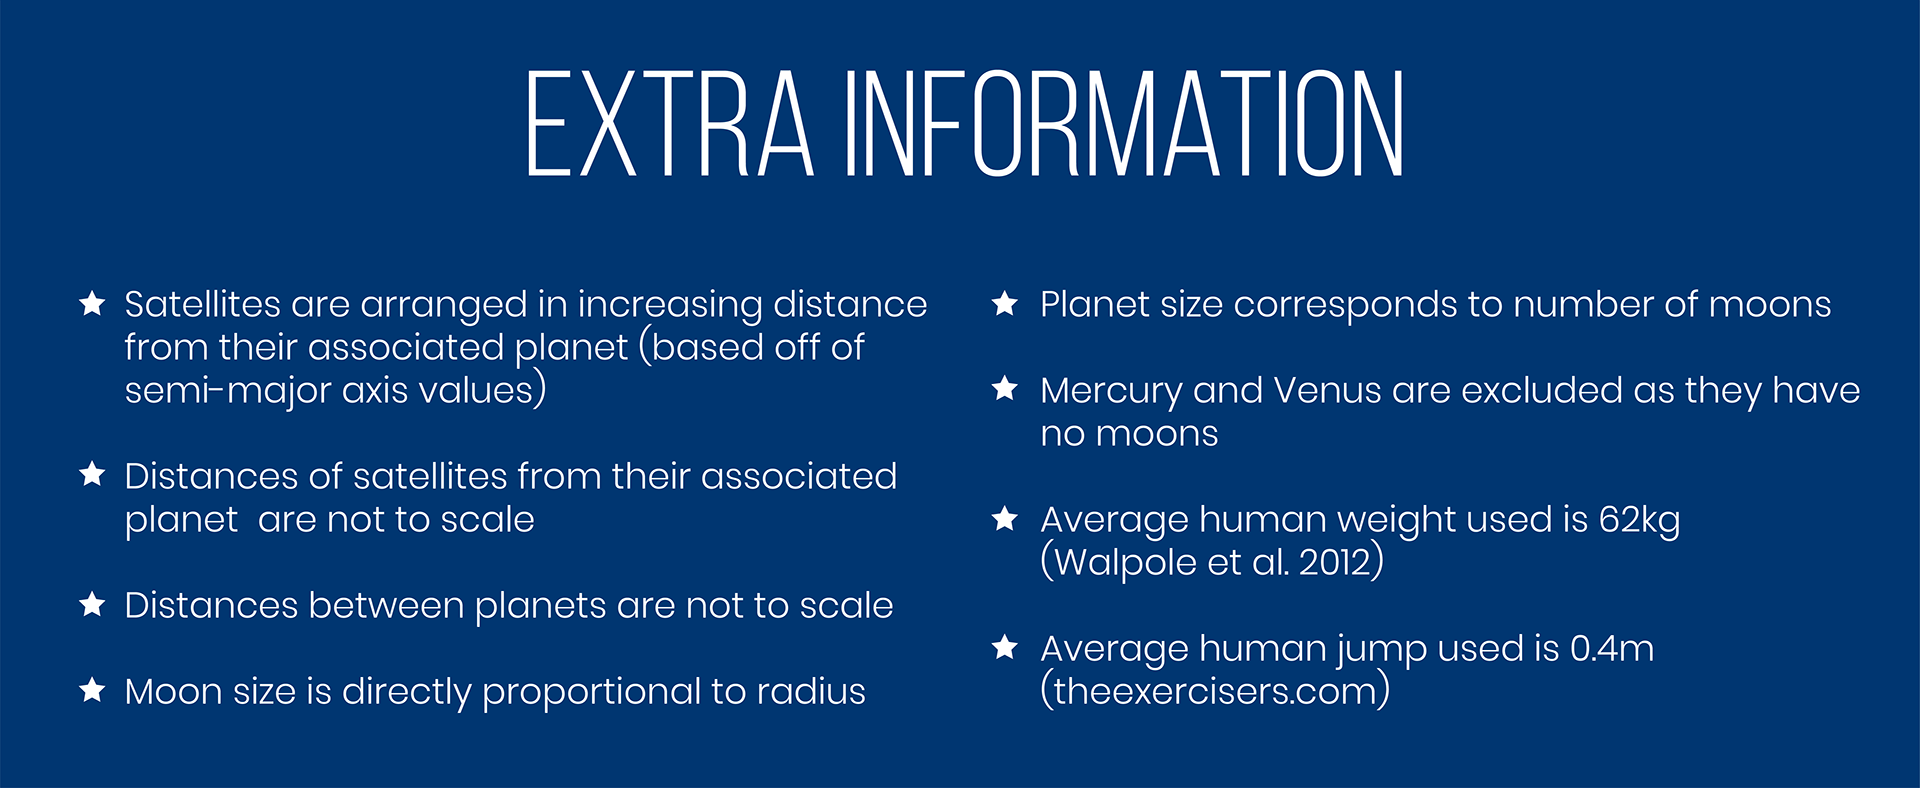
When we think of "moon," we automatically think of the beautiful white orb in the night sky. Most people are unaware of the hundreds of other moons within our solar system. This project is intended to simplify the vast amount of data from NASA’s Jet Propulsion Laboratory into an educational poster. It illustrates how many moons each planet has, as well as unique characteristics of those moons. Some of these moons may even be able to sustain life. I wanted the audience to imagine what it could be like on one of these moons.
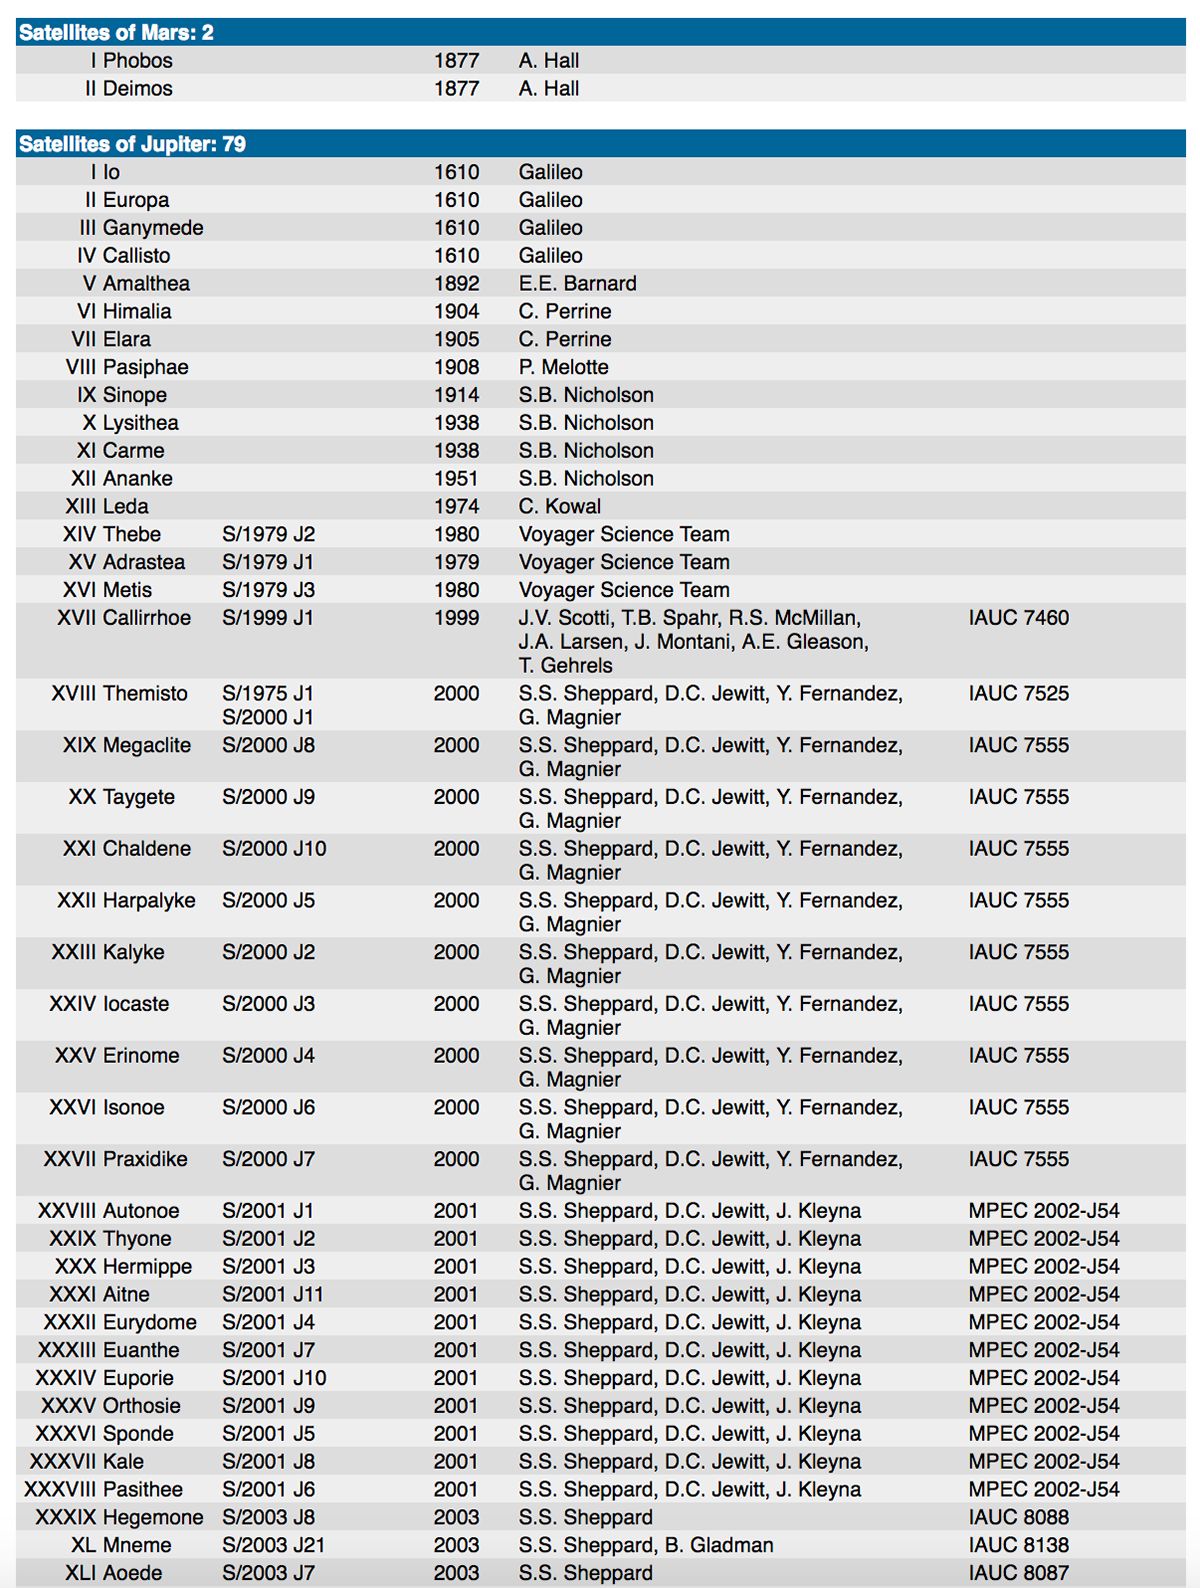
Data Collection
Data was taken from NASA’s Jet Propulsion Laboratory and a couple other resources.
It started out something like this:
It started out something like this:
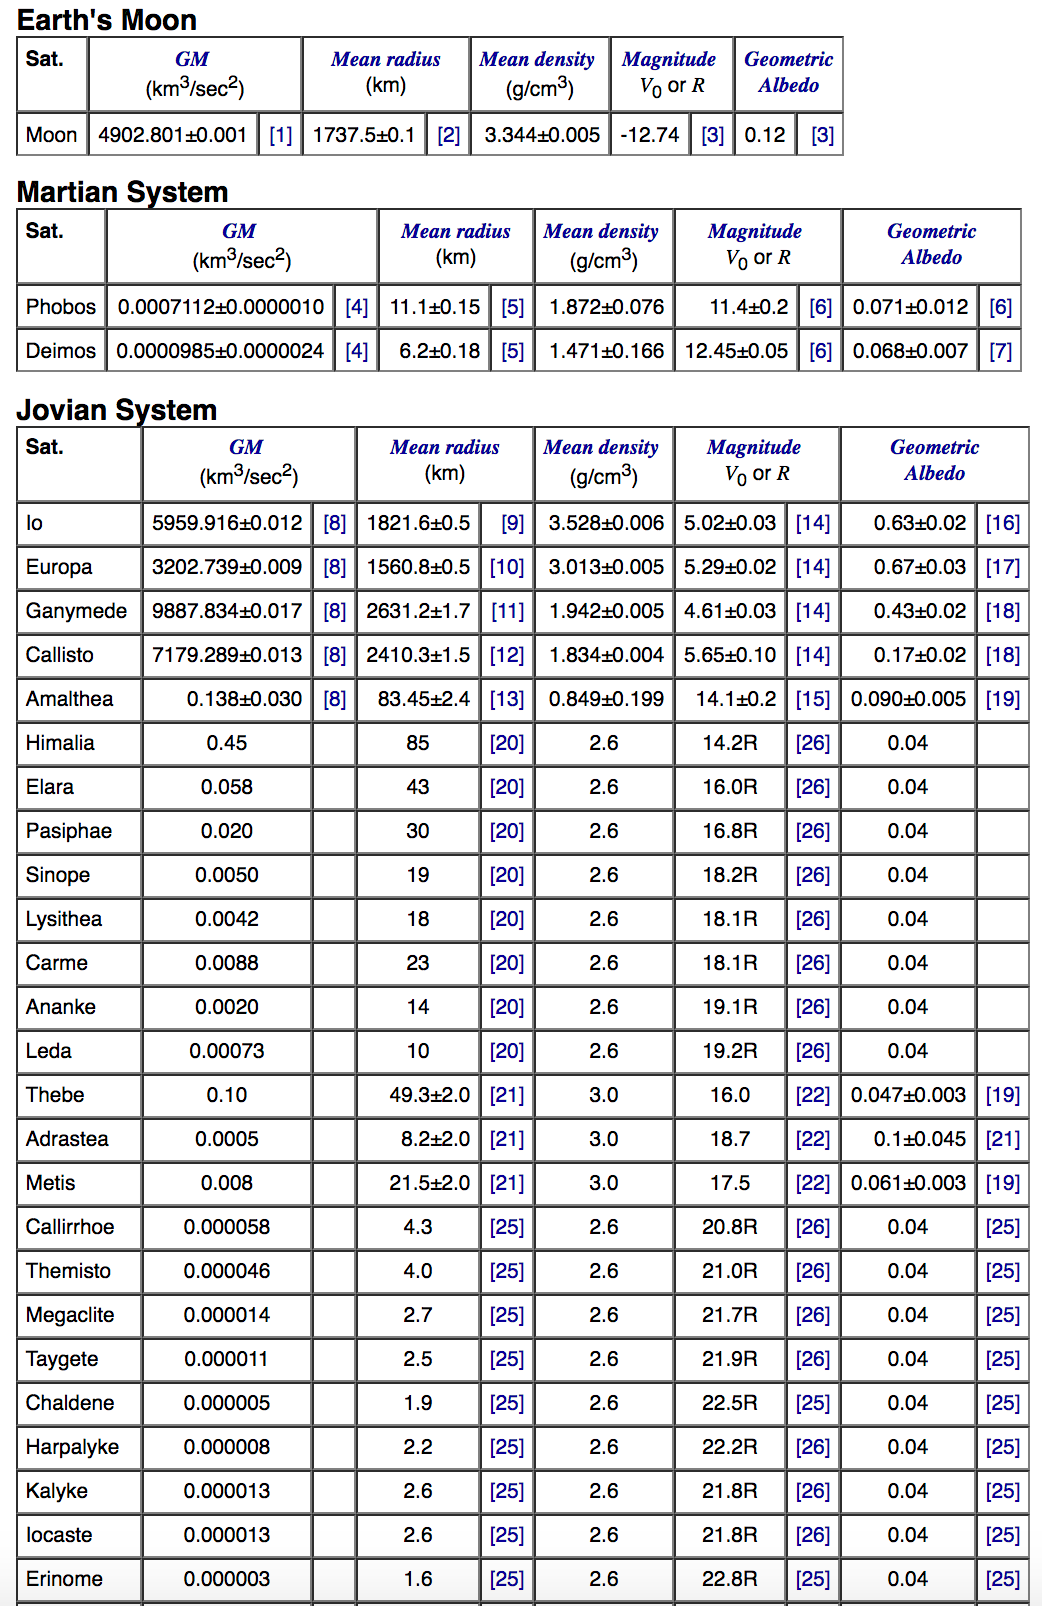

I then organized the data into an Excel spreadsheet.
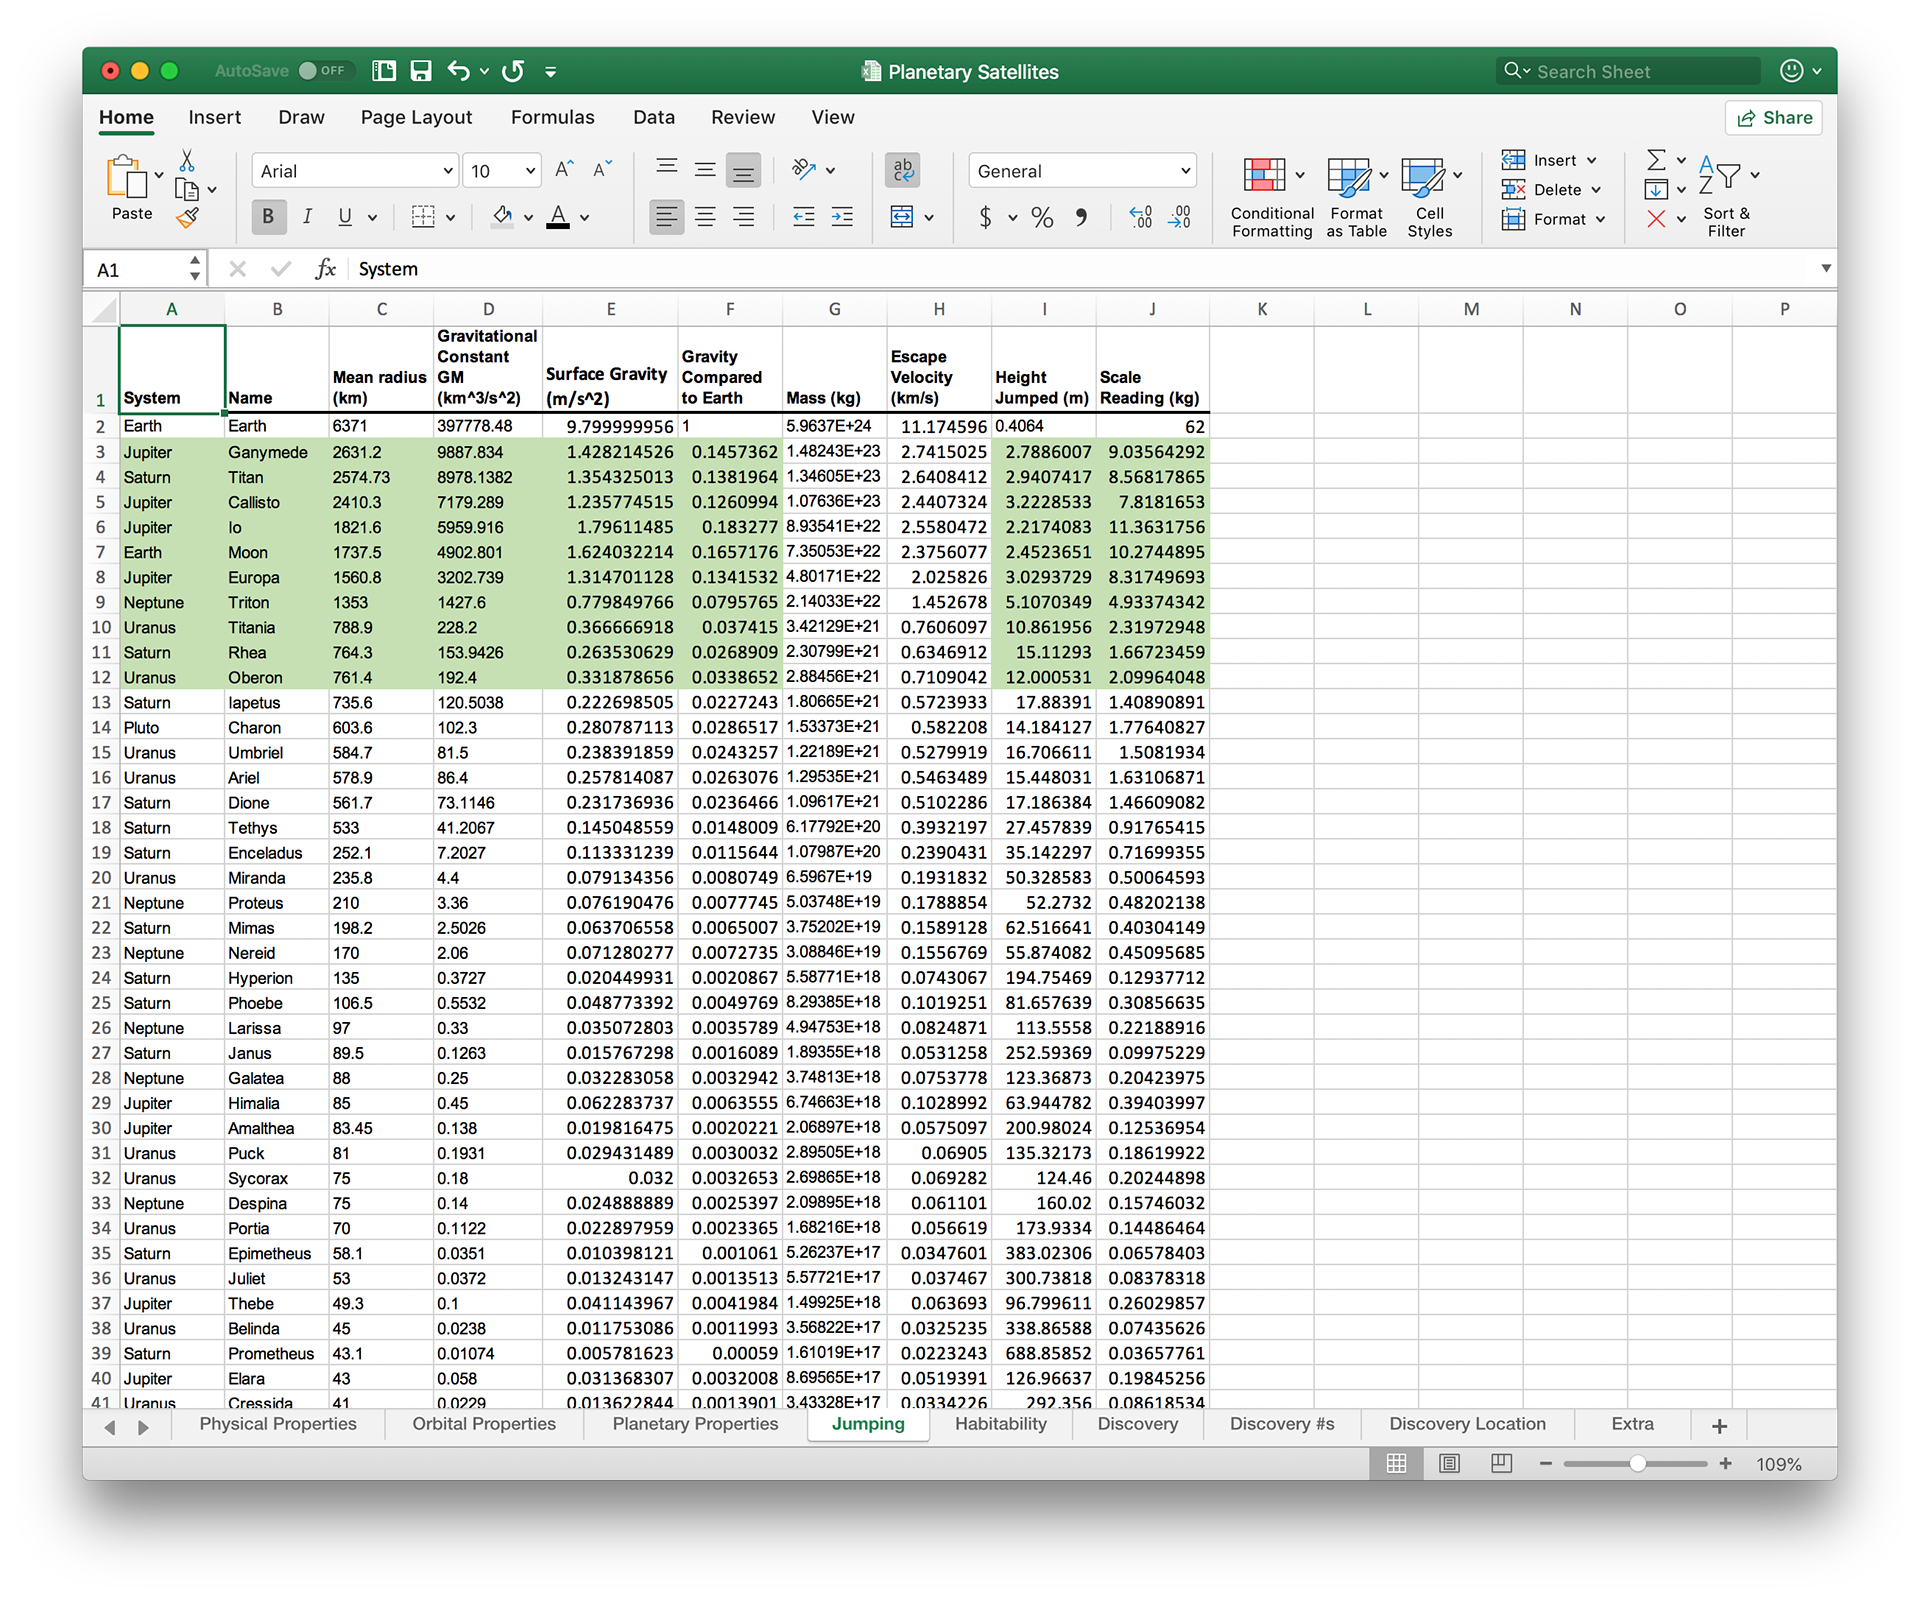
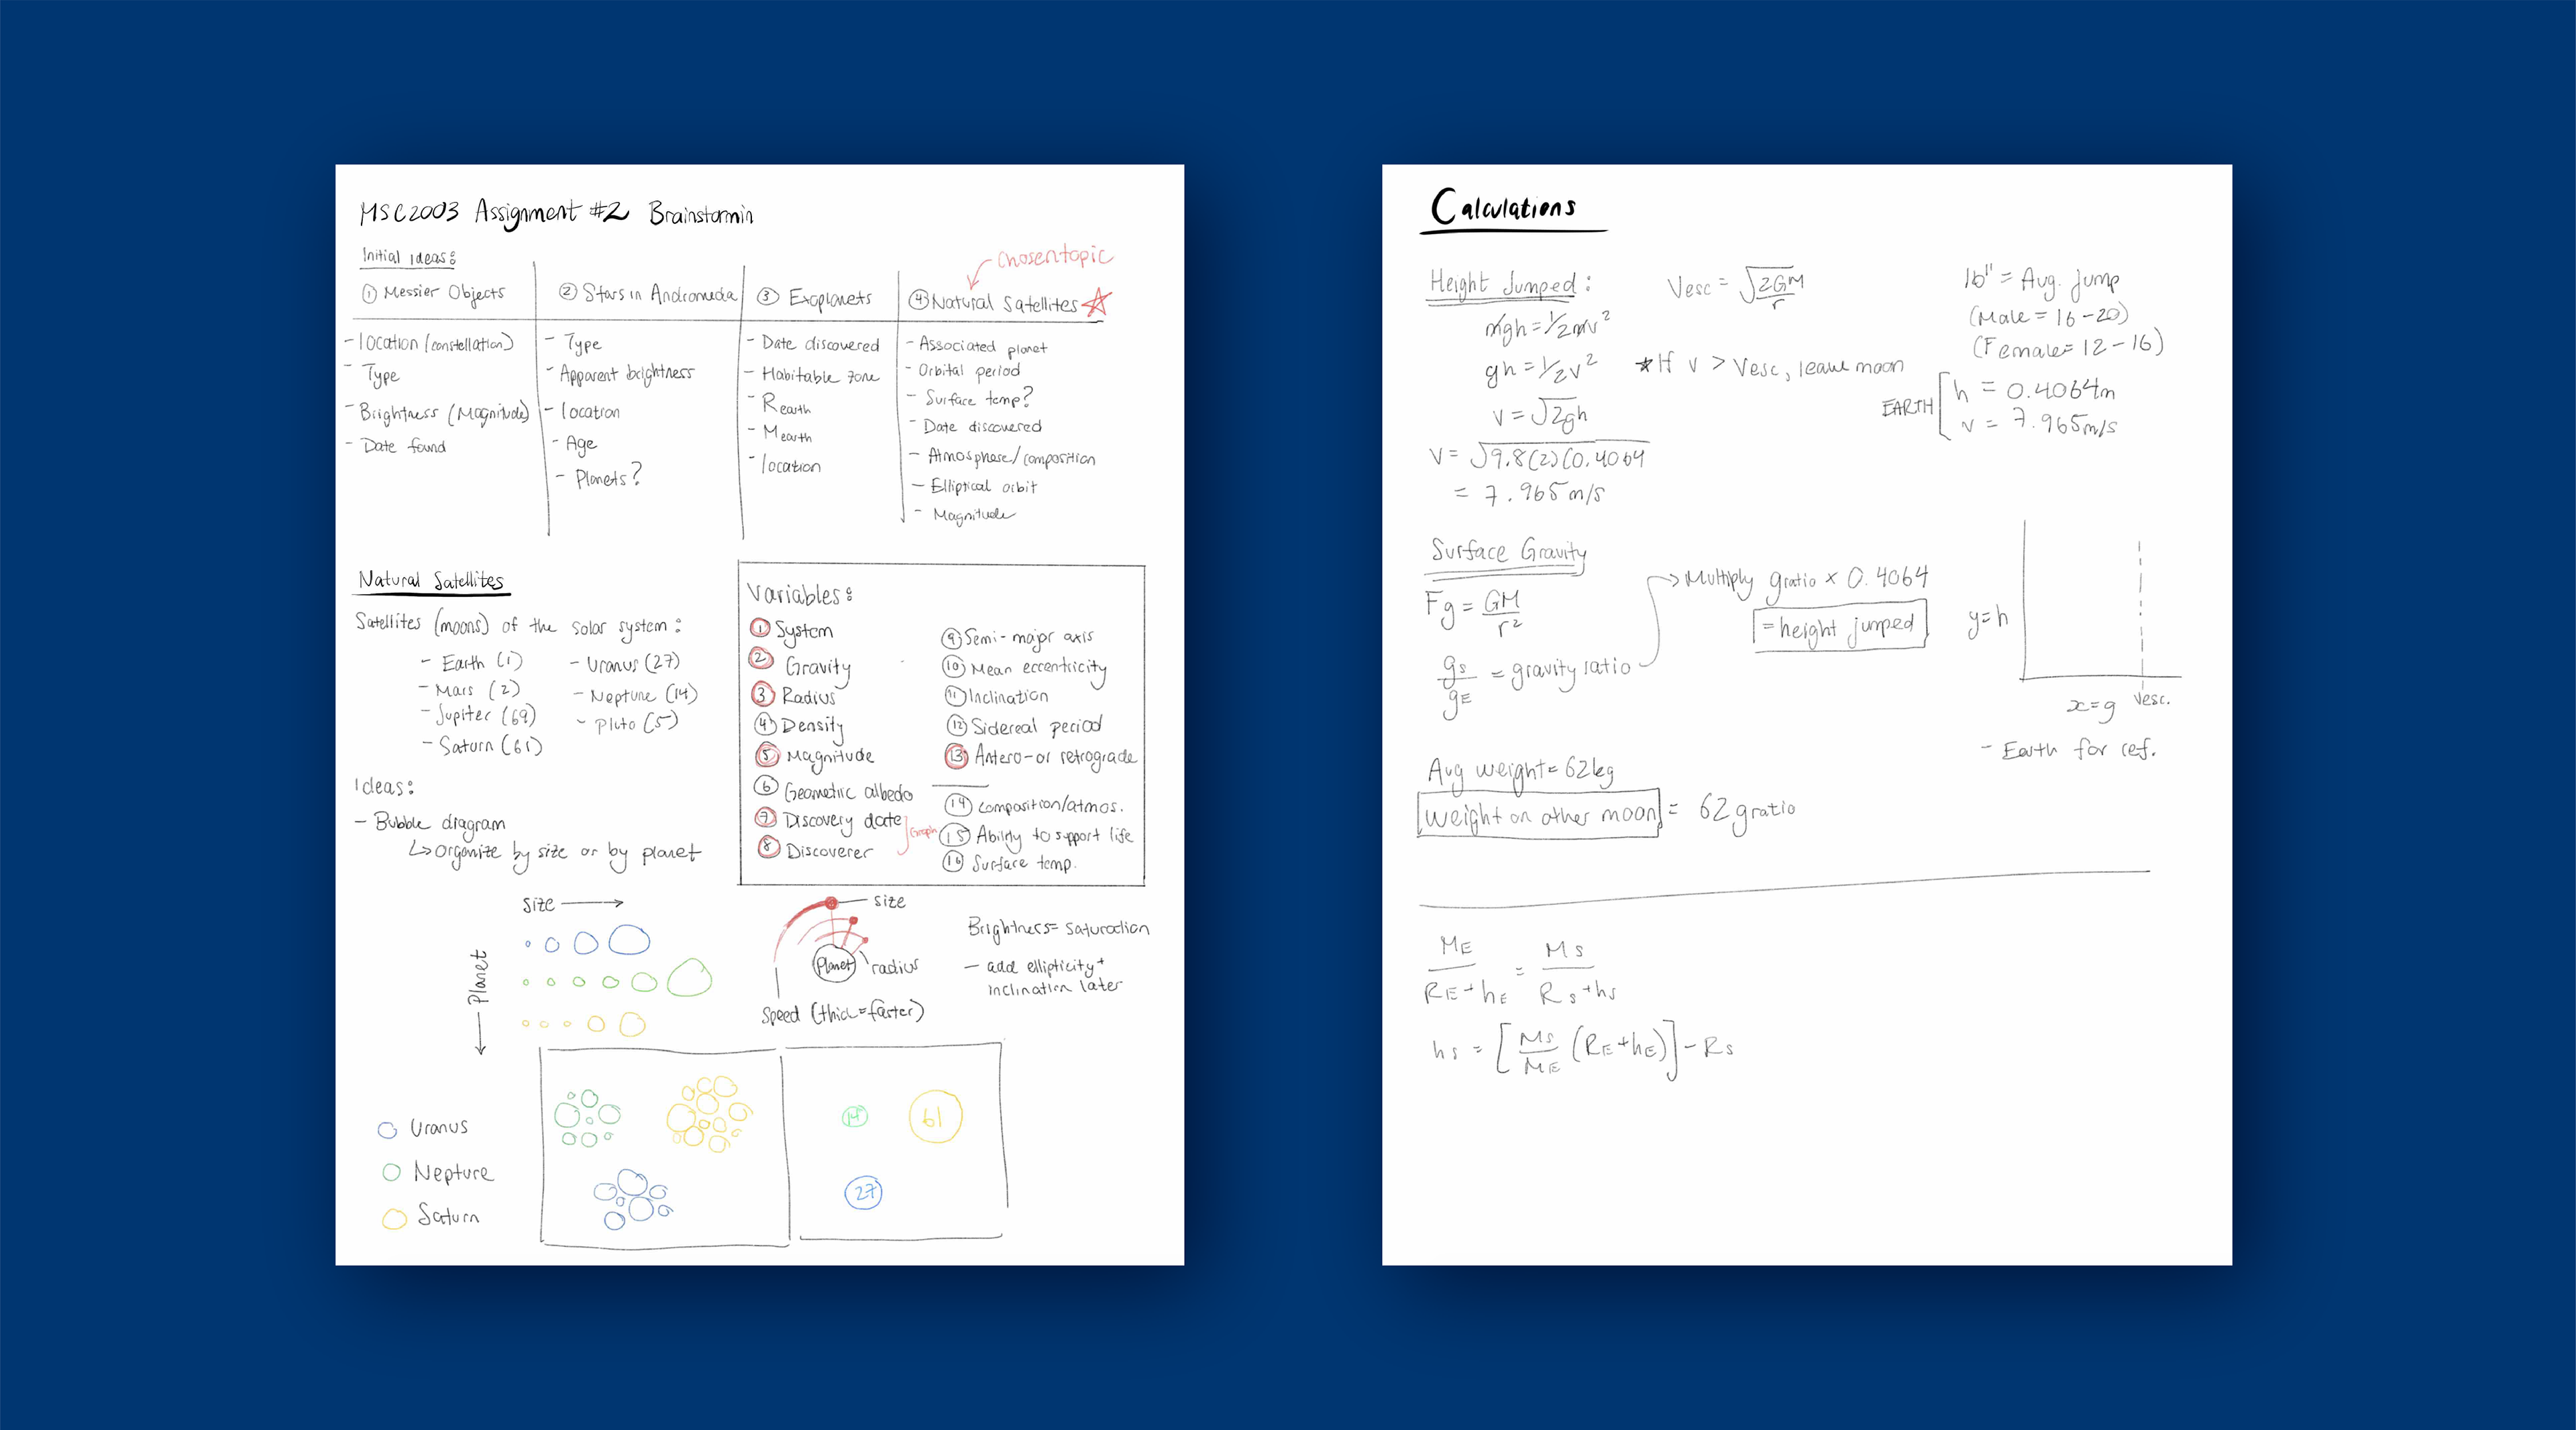
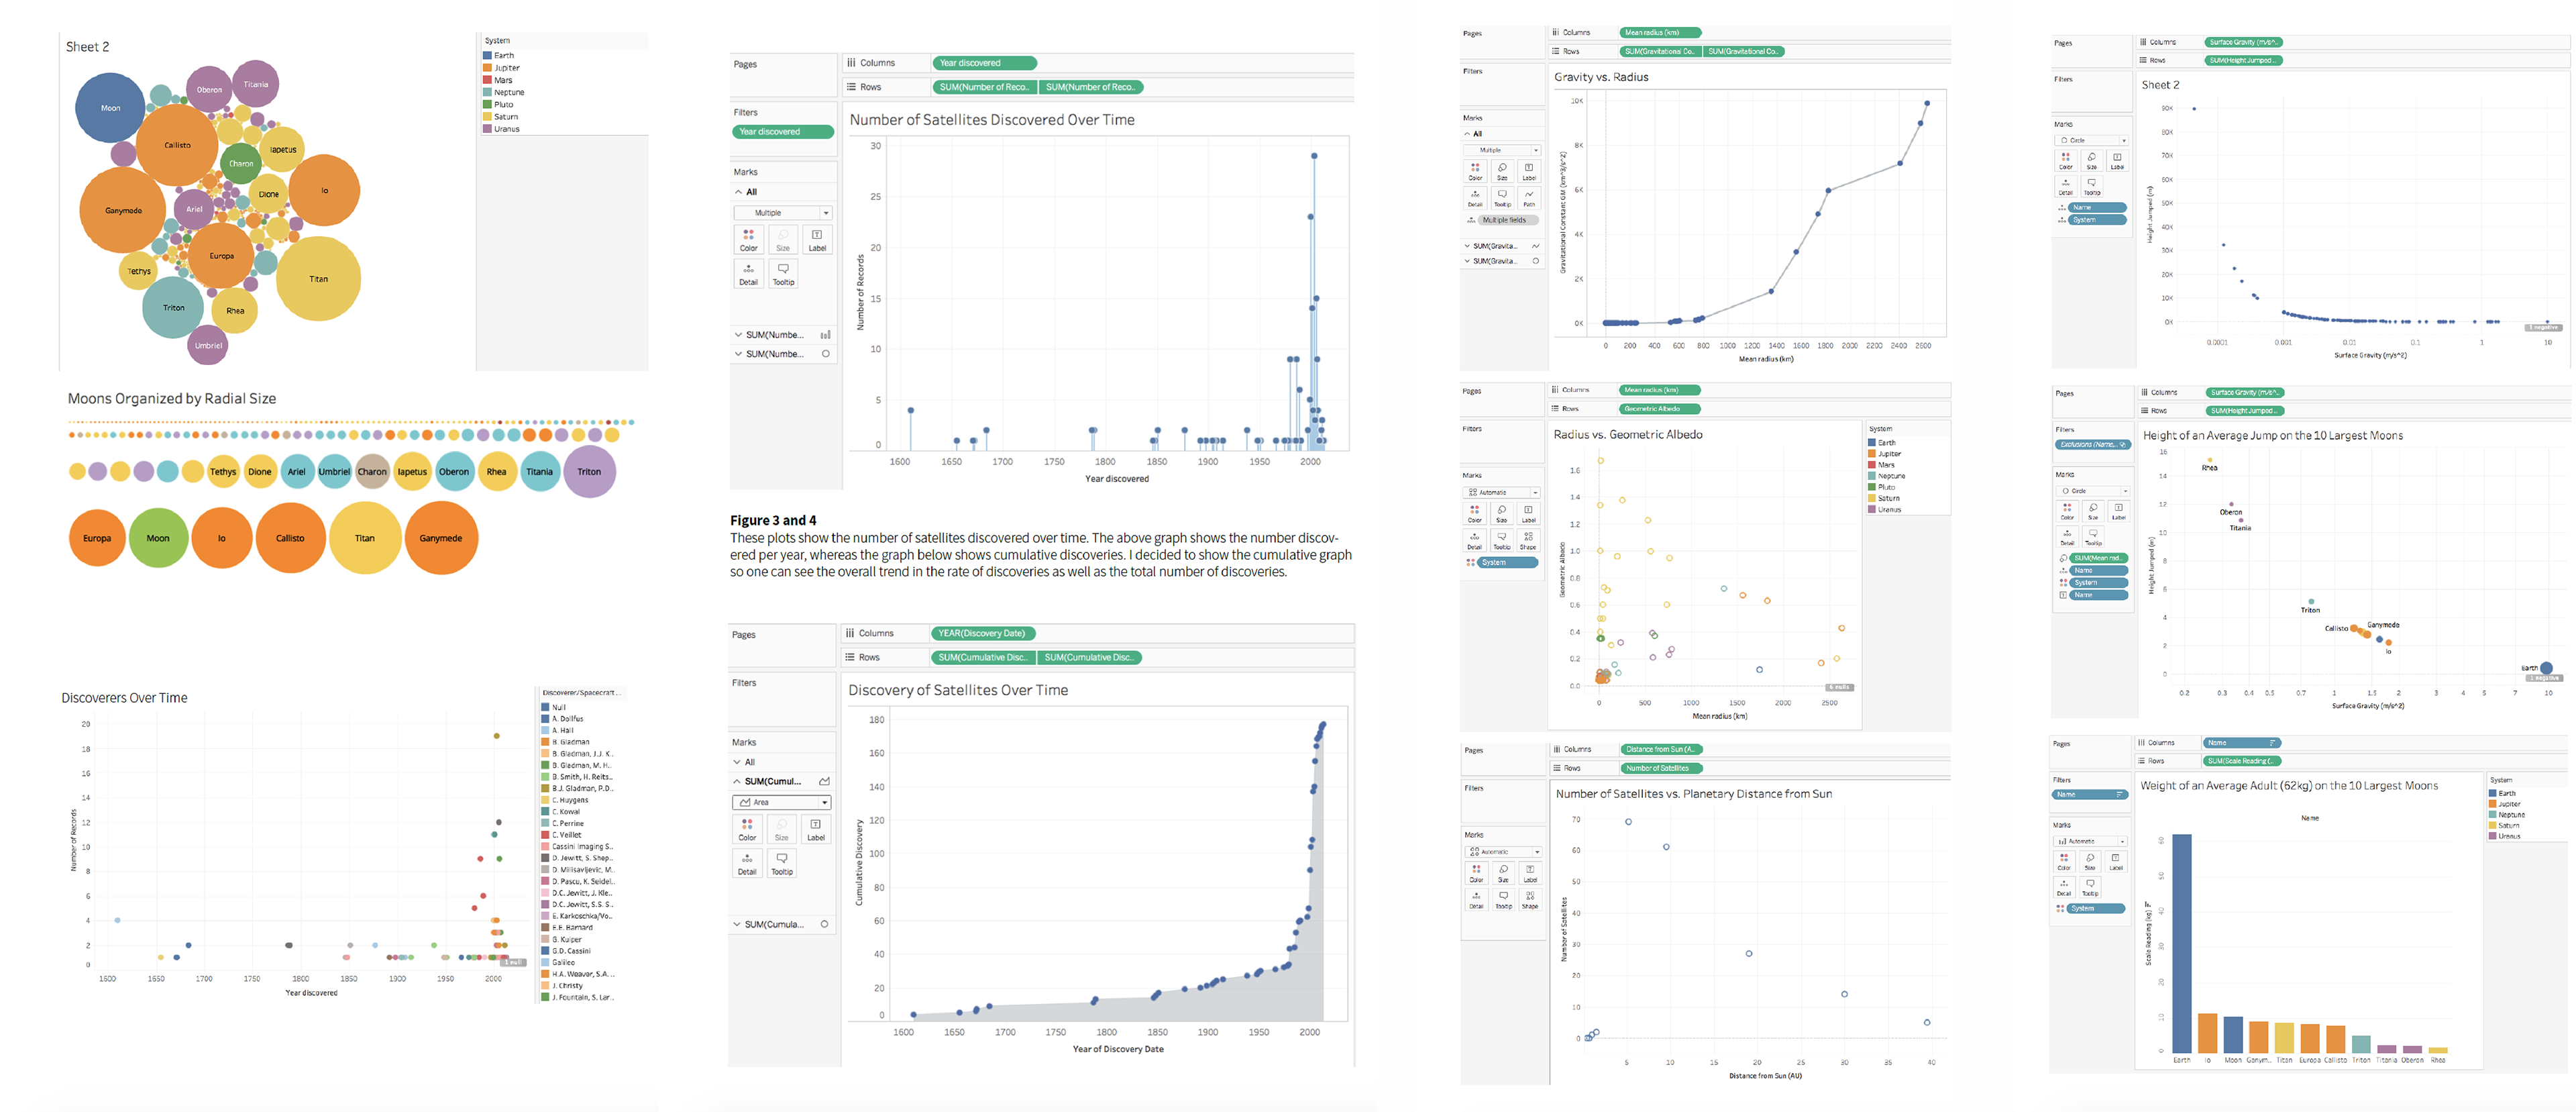
Once I had the data, I needed to figure out which variables and properties are the most important and interesting to a lay audience. After playing around with the variables and design, I realized that the raw data could be made more relevant to the audience with some additional steps.
This meant I had to become reacquainted with the gravitational equation! It took a while to brush up on my physics, but eventually I came up with some equations to calculate how much an average human would weigh and how high an average human could jump on the 10 largest moons. It makes for a fun mental picture, no?
After determining which data I wanted to use, I streamlined the spreadsheet, imported it into Tableau, and played around with different ways to visualize the information.
Design Production
The graphs and visualizations created in Tableau were exported as PDFs, which were then brought into Illustrator. I played around with various ways to show the data before settling on the final layout.


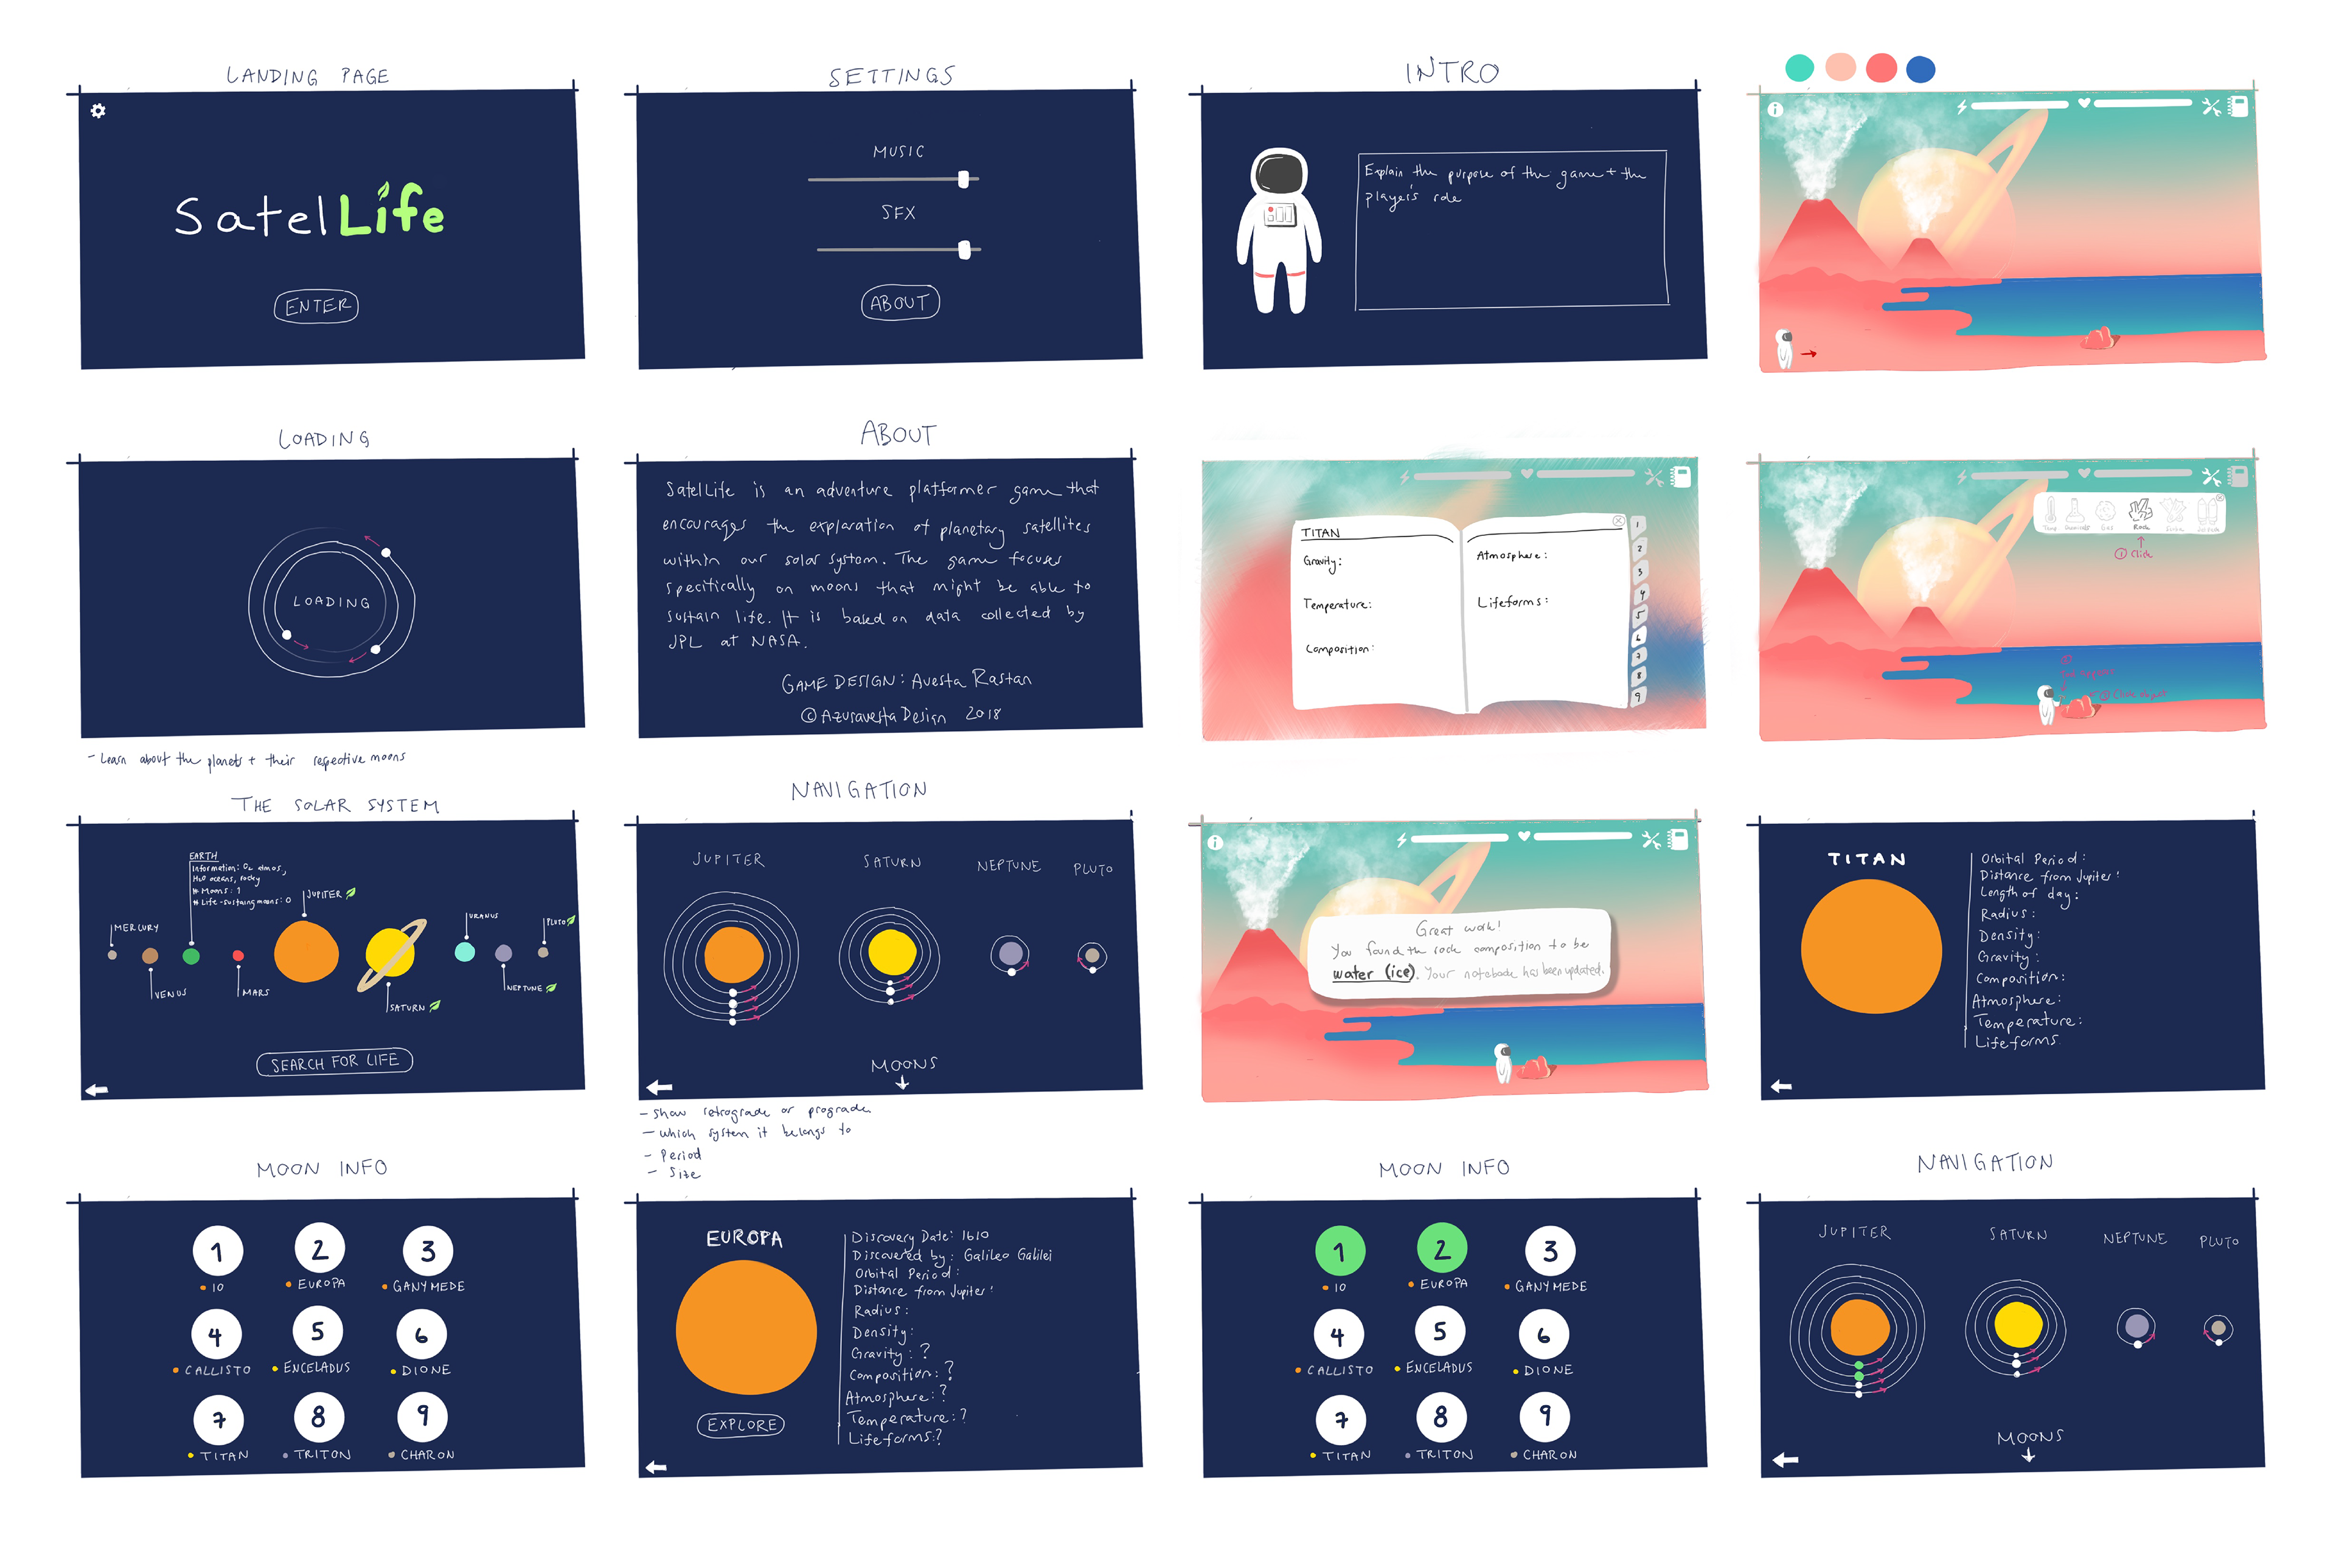
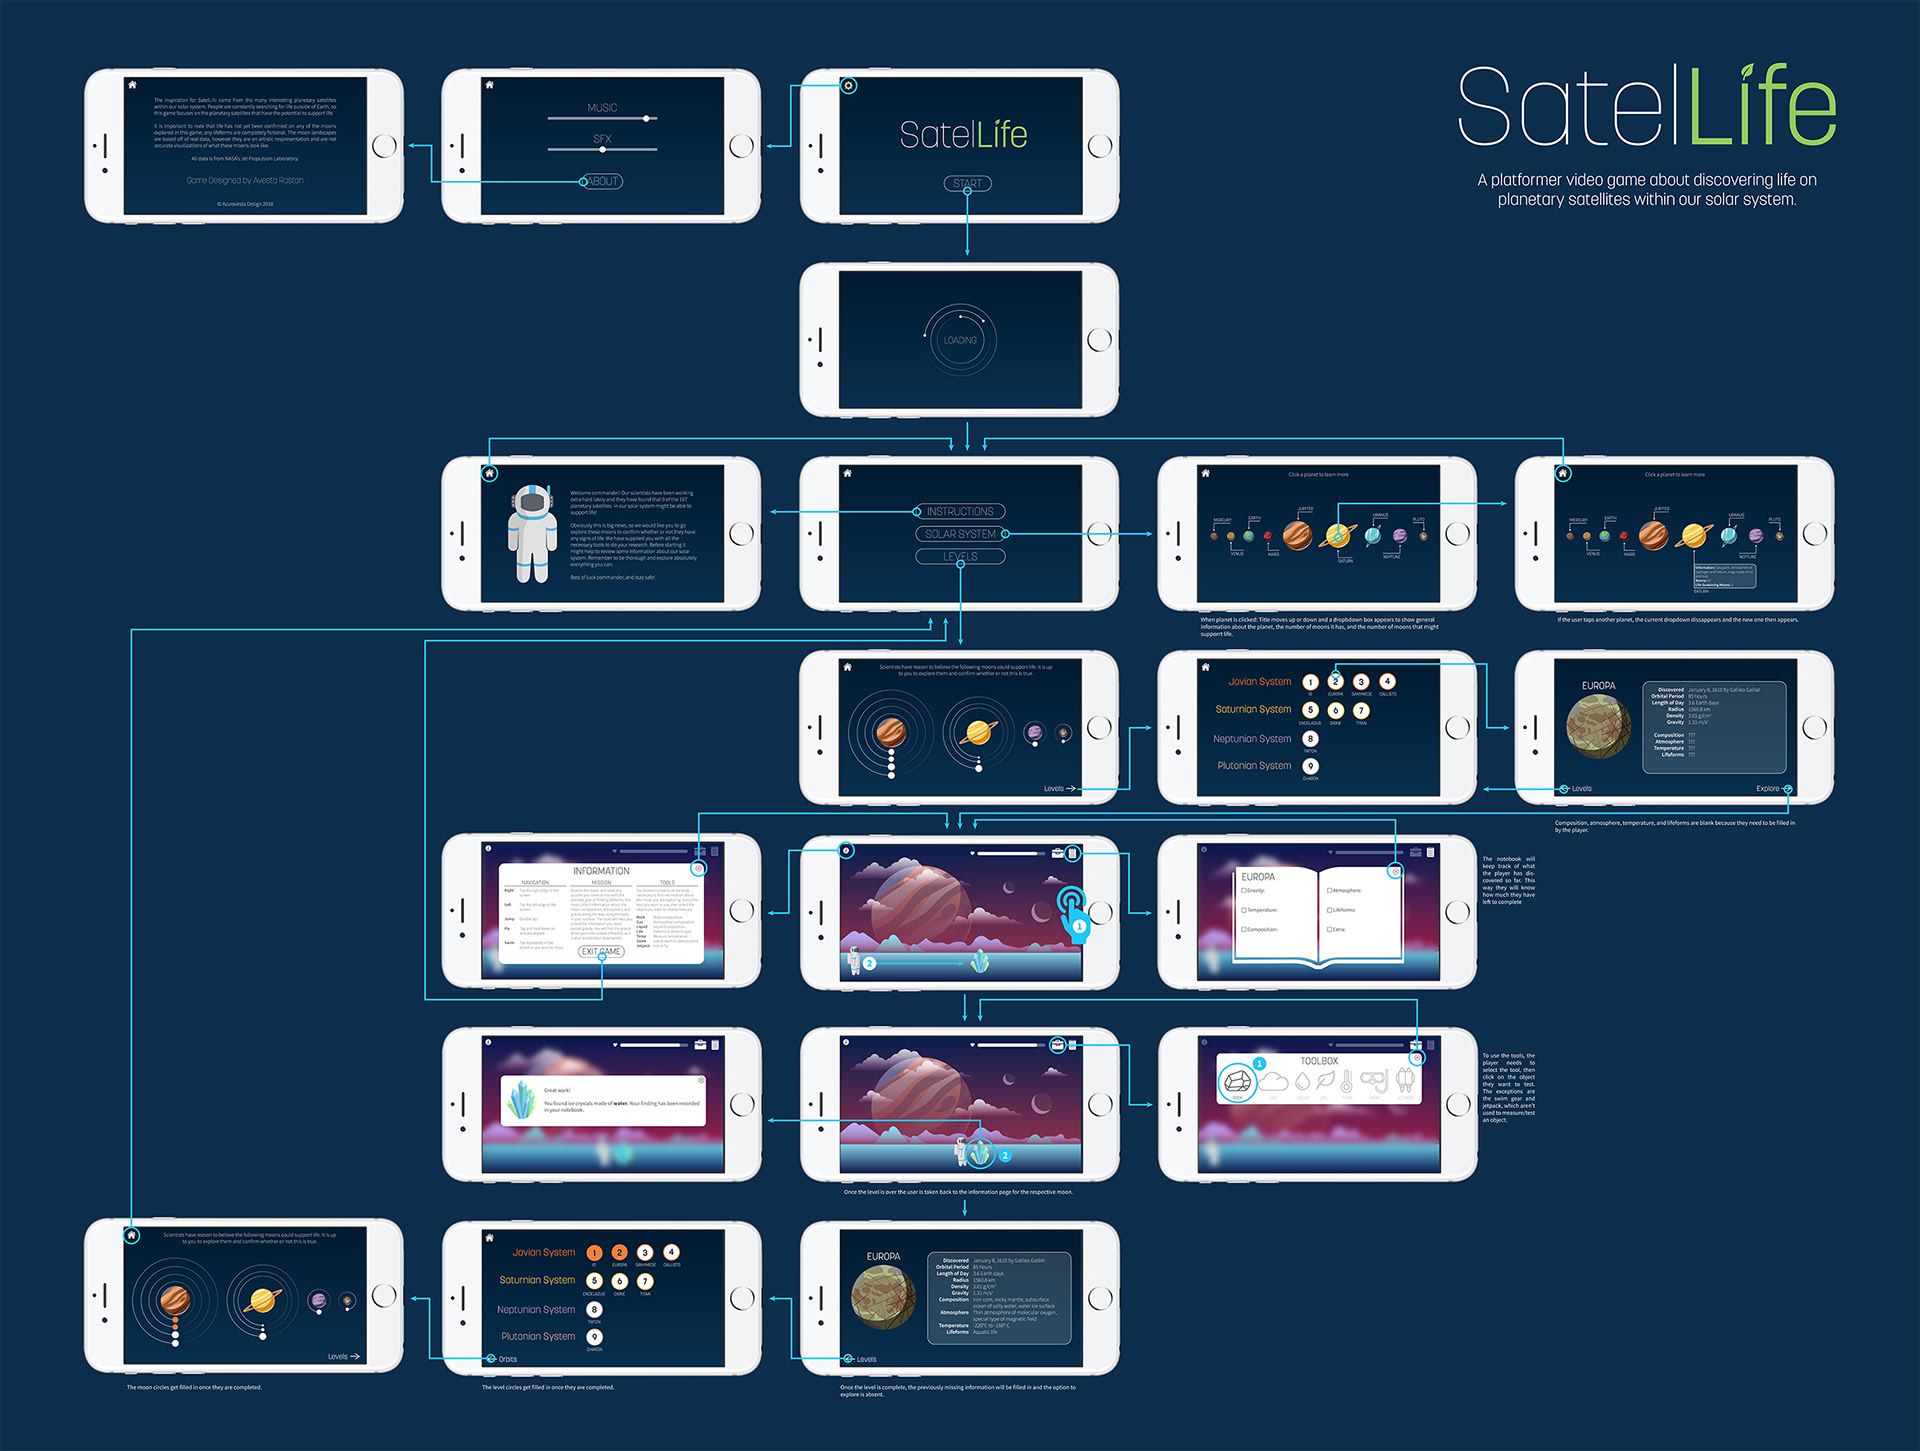
Video Game Concept
I expanded this project into an interactive data visualization. My intent was to educate a lay audience in a fun and engaging way; hence, I designed a platformer game for mobile. After brainstorming and creating low-fidelity mockups, I designed a user interaction board to describe the navigation.